
Global Stock to Bond Ratio and U.S. Recessions
Global Stock to Bond Ratio and U.S. Recessions Should investors be worried that the global stock-to-bond ratio is rolling over? Image: MBR Partners
Global Stock to Bond Ratio and U.S. Recessions Should investors be worried that the global stock-to-bond ratio is rolling over? Image: MBR Partners

S&P 500 Earnings Revisions Breadth vs. Dollar Index (DXY) A strong U.S. dollar doesn’t bode well for earnings revisions. Image: Morgan Stanley Research

U.S. Inflation Rate and S&P 500 Price/Earnings Ratio, YoY Change (Leading Indicator) The change in U.S. inflation rate tends to lead U.S. equity valuation by 6 months. Image: Pictet Asset Management

S&P 500 and U.S. Financial Conditions Should U.S. equity investors expect a new YTD low on the S&P 500? Image: BofA Global Research

% of Nasdaq Constituents Down 50% or More from their Price Highs More than 50% of Nasdaq stocks are down 50% or more from their price highs. Image: J.P. Morgan

Univ. of Mich. Consumer Sentiment Index and Russell 1000 Index, Trailing 12-Month Gross Profit Margin Should investors expect gross profit margins to disappoint in the coming months? Image: Morgan Stanley Wealth Management

U.S. Recessions Recessions in the United States are becoming rarer over time. Image: Goldman Sachs Global Investment Research

Cyclical/Defensive Equities Ratio vs. 10-Year Treasury Yield The 10-year U.S. Treasury yield and the cyclicals/defensives ratio have decoupled. Image: Morgan Stanley Research
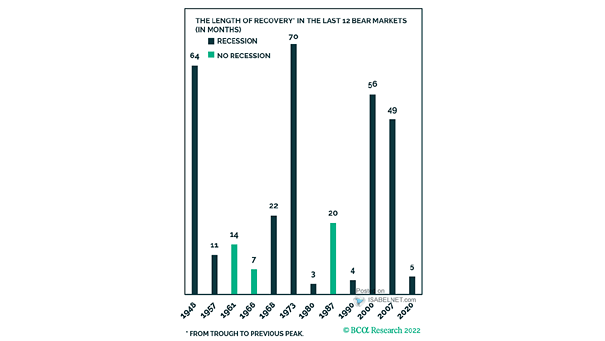
The Length of Recovery in the Last 12 Bear Markets Should investors remain cautious on equities, as capitulation has not been reached for risk assets? Image: BCA Research
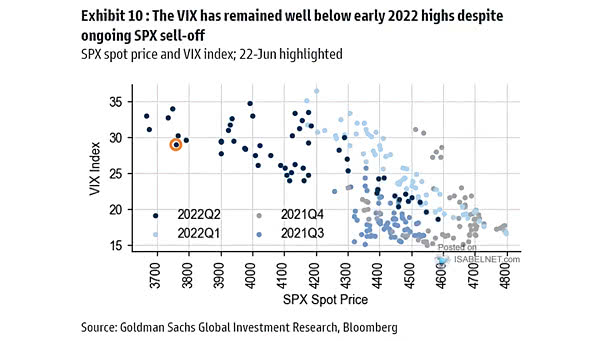
Volatility – S&P 500 Spot Price and VIX Index The VIX remains below early 2022 peaks, despite the sell-off. Image: Goldman Sachs Global Investment Research
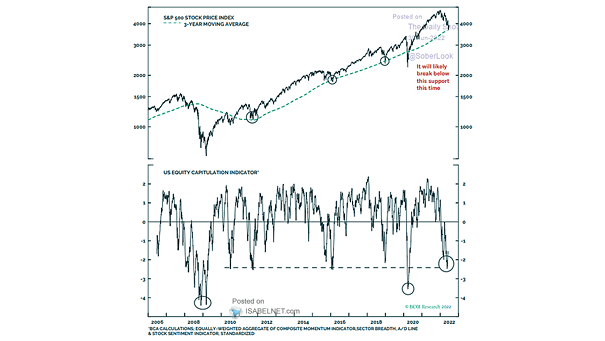
S&P 500 Index and 3-Year Moving Average The S&P 500 will likely break below its 3-year moving average, as recession fears mount. Image: BCA Research