ISM Manufacturing PMI and S&P 500 Operating Margin
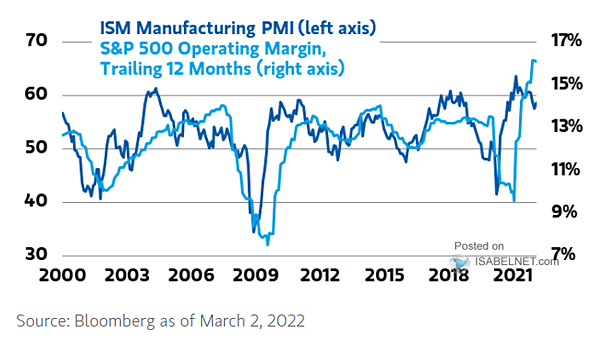
ISM Manufacturing PMI and S&P 500 Operating Margin The Manufacturing Purchasing Managers Index has peaked. Will S&P 500 operating profit margins roll over? Image: Morgan Stanley Wealth Management
ISM Manufacturing PMI and S&P 500 Operating Margin The Manufacturing Purchasing Managers Index has peaked. Will S&P 500 operating profit margins roll over? Image: Morgan Stanley Wealth Management
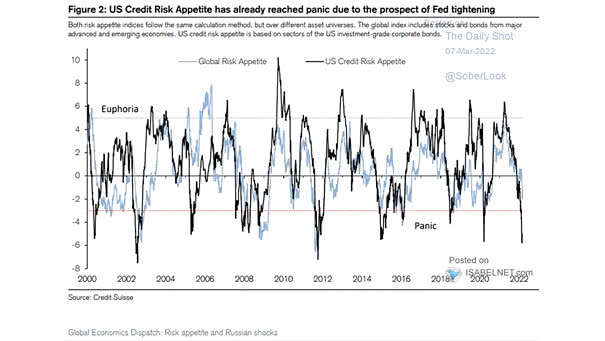
U.S. Credit Risk Appetite and Global Risk Appetite U.S. credit risk appetite has reached panic level, which is contrarian bullish. Image: Credit Suisse Research
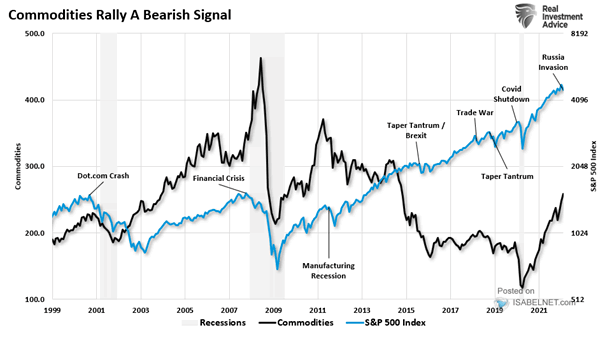
S&P 500 Index vs. Commodities The sharp rise in commodity prices could be bearish for U.S. stocks. Image: Real Investment Advice
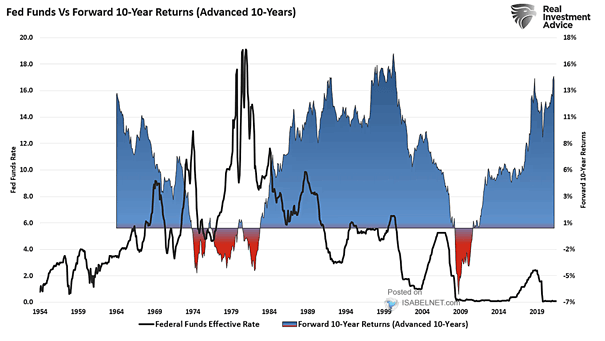
Fed Funds vs. Forward 10-Year Returns (Advanced 10-Years) When the Fed hikes interest rates, future returns tend to decline. Image: Real Investment Advice
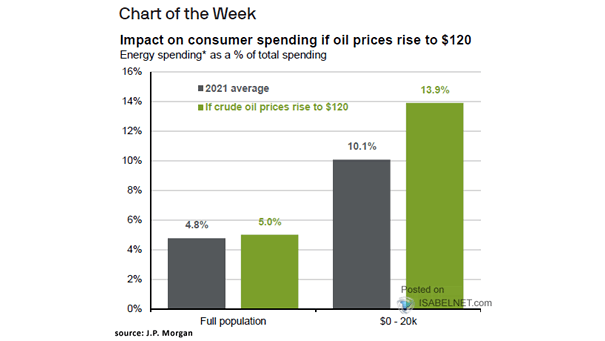
Impact on U.S. Consumer Spending If Oil Prices Rise to $120 If oil prices remain elevated, will the Fed raise interest rates more gradually than markets expect? Image: J.P. Morgan Asset Management
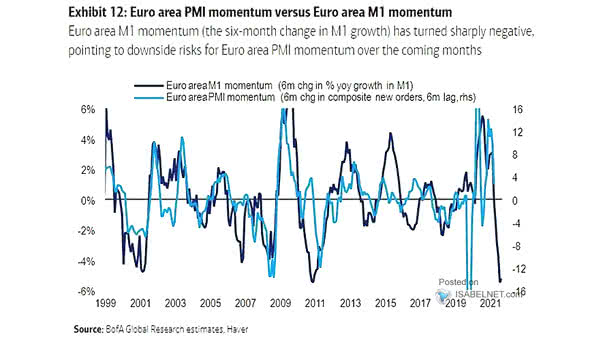
European Stocks – Euro Area M1 Momentum vs. Euro Area PMI Momentum Should investors be bearish on European stocks? Image: BofA Global Research
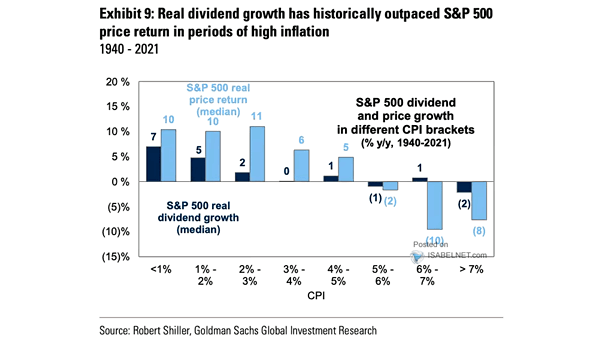
Return – S&P 500 Real Dividend Growth and High Inflation In periods of high inflation, real dividend growth has outpaced S&P 500 price return. Image: Goldman Sachs Global Investment Research
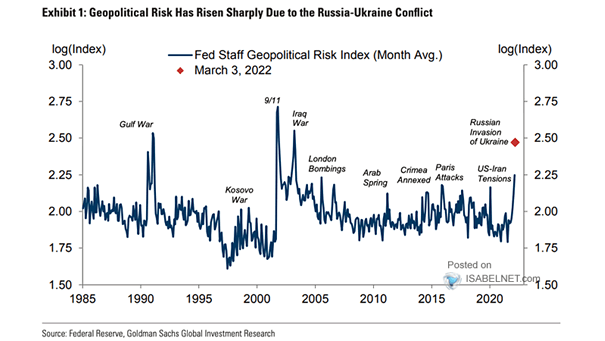
Fed Staff Geopolitical Risk Index Geopolitical risk has risen significantly since the start of the Russia-Ukraine conflict. Image: Goldman Sachs Global Investment Research
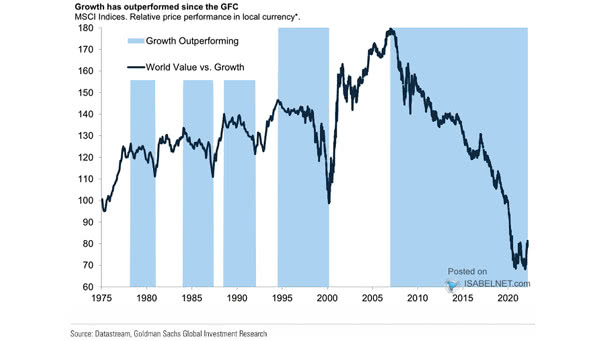
Stocks – World Value vs. Growth Growth has outperformed Value since the GFC. Does the secular trend still favor Growth? Image: Goldman Sachs Global Investment Research
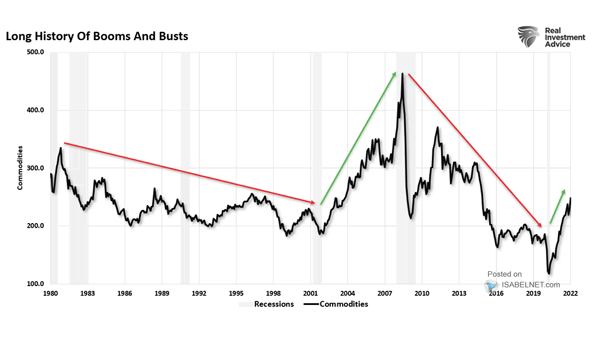
Commodities – Long History of Booms and Busts Should investors expect a long-term commodity boom? Image: Real Investment Advice
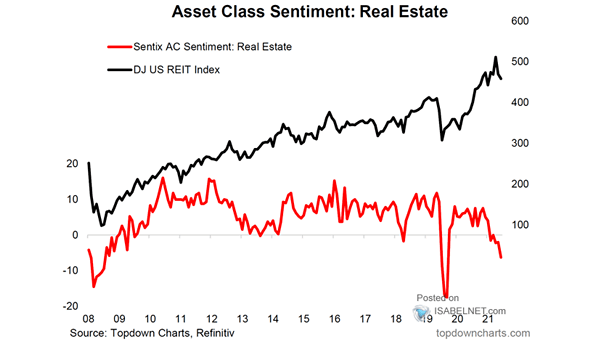
Asset Class Sentiment – Real Estate Real estate asset sentiment is bad, which is contrarian bullish. Image: Topdown Charts