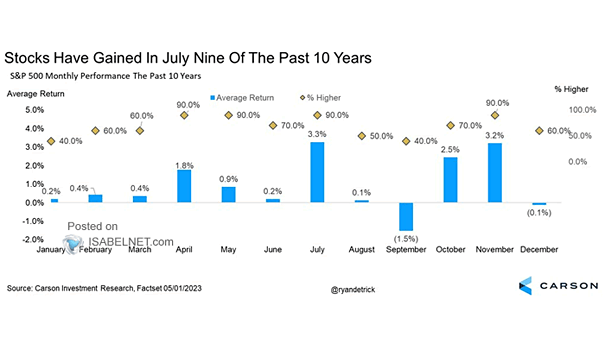
S&P 500 Monthly Performance the Past 20 Years
S&P 500 Monthly Performance the Past 20 Years This year’s conflict in the Middle East has clouded the outlook, but history still favors the bulls: April has rewarded U.S. stocks 80% of the time over…
S&P 500 Monthly Performance the Past 20 Years This year’s conflict in the Middle East has clouded the outlook, but history still favors the bulls: April has rewarded U.S. stocks 80% of the time over…
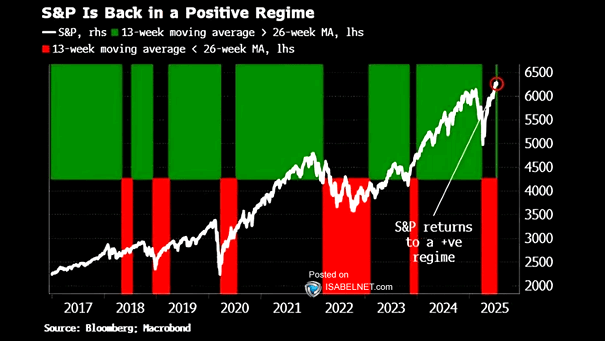
S&P 500 – 13-Week and 26-Week Moving Average The S&P 500 remains in a bull trend with the 13-week moving average still above the 26-week, but the gap has narrowed enough to raise caution. Image:…
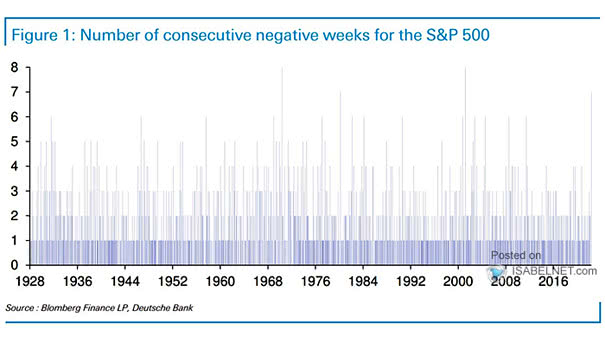
Number of Consecutive Negative Weeks for the S&P 500 Five straight weeks of declines might rattle investors, but history reminds us that such runs often mark turning points rather than lasting downturns. Markets often rebound…
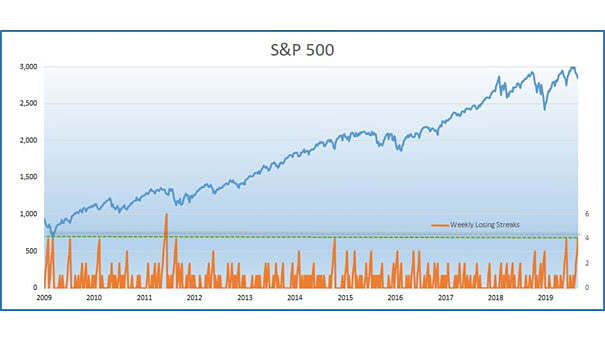
S&P 500 Weekly Losing Streaks If the S&P 500 ends in the red today, it would mark a record 10th consecutive losing Thursday. But the last trading day before Good Friday has a habit of…
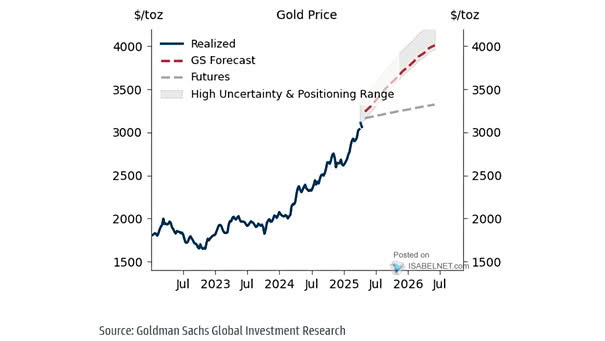
Gold Price Forecast Goldman Sachs is holding firm on its bullish gold call, reaffirming a December 2026 target of $5,400 an ounce even as recent volatility and bouts of profit-taking test investor nerves. Image: Goldman…
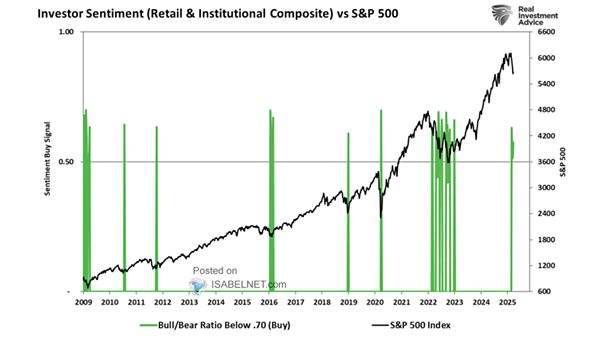
Investors Intelligence Bull-Bear Spread and S&P 500 Bulls are slipping out the side door. Over the past decade, every sustained S&P 500 gain came when the II bull‑bear spread topped 20%. That kind of conviction…

Bloomberg Dollar Spot Index The U.S. dollar’s sharp March rally fits the familiar script: investors rush back to the greenback when global risk sentiment turns sour, seeking its safety and deep liquidity. Image: Bloomberg
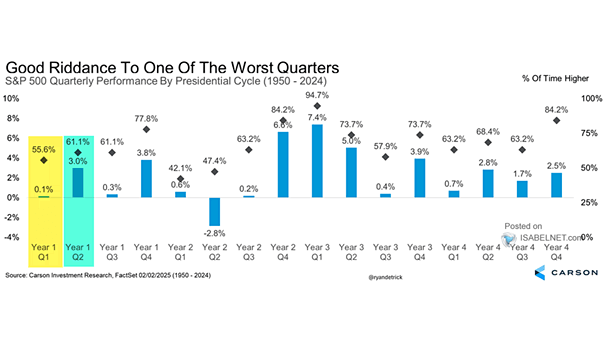
S&P 500 Quarterly Returns Based on the Four-Year Presidential Cycle Midterm election years have a rough reputation. Q2 is usually the weakest quarter in the presidential cycle for U.S. stocks. With Q1 set to close…
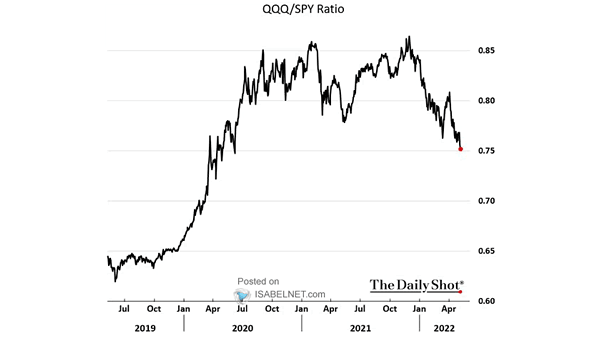
Nasdaq 100 to S&P 500 Valuation Spread The last time the Nasdaq 100 traded this cheap versus the S&P 500, it staged its biggest outperformance in a year. Honestly, that’s tough to ignore. Image: Bloomberg
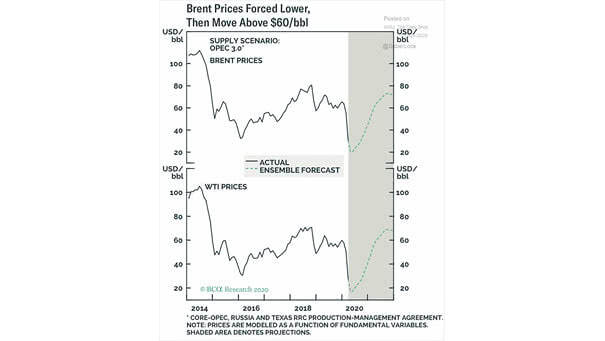
Brent Crude Oil Futures Markets are betting the Middle East conflict won’t drag on, a view reflected in oil futures prices. The curve remains in backwardation, indicating tight near‑term supply but confidence that any disruption…
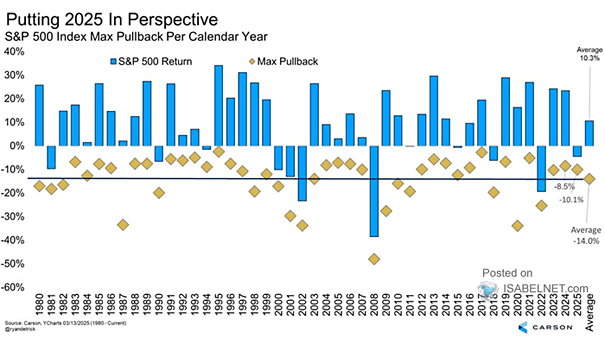
S&P 500 Index Max Pullback per Calendar Year Markets are never a straight ride up. Since 1980, the S&P 500 has averaged double‑digit gains while dropping roughly 14% each year. Volatility is simply the cost…