Implied Allocations: Gold Miners
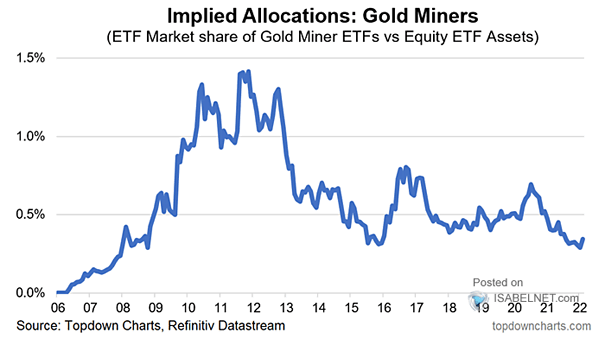
Implied Allocations: Gold Miners Allocation to gold miners remains low. Should investors be bullish on gold miners as valuations are reasonable? Image: Topdown Charts
Implied Allocations: Gold Miners Allocation to gold miners remains low. Should investors be bullish on gold miners as valuations are reasonable? Image: Topdown Charts
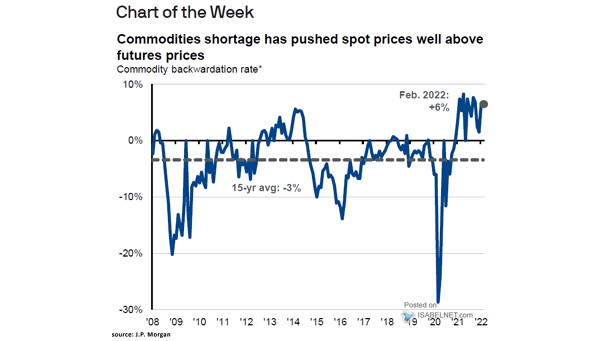
Commodities – Commodity Backwardation Rate Current commodity spot prices are higher than futures prices due to tight supply and strong demand. Image: J.P. Morgan Asset Management
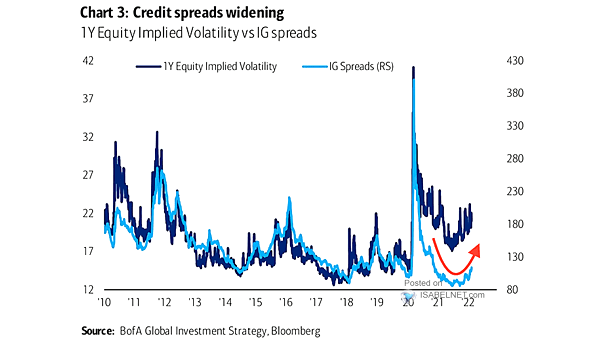
1-Year Implied Volatility vs. IG Spreads Credit spreads are widening and BofA still sees a rates shock this year. Image: BofA Global Investment Strategy
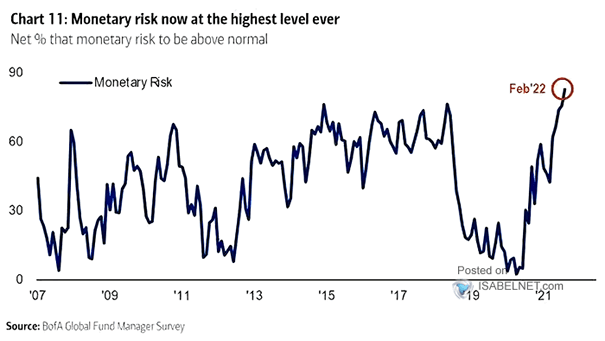
FMS Investors – Net % That Monetary Risk to Be Above Normal Does tightening monetary policy pose the greatest risk to financial market stability? Image: BofA Global Fund Manager Survey
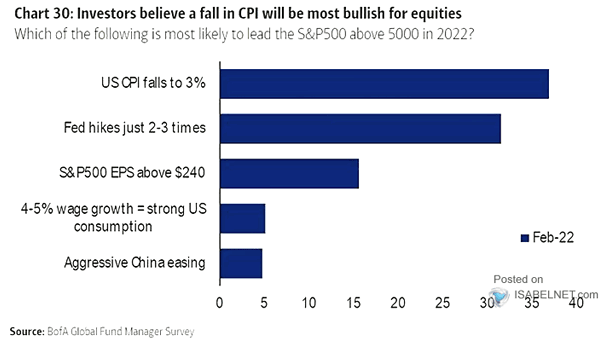
FMS Investors – Which of the Following Is Most Likely to Lead the S&P 500 Above 5000? Could a drop in U.S. CPI to 3% drive the S&P 500 above 5000? Image: BofA Global Fund…
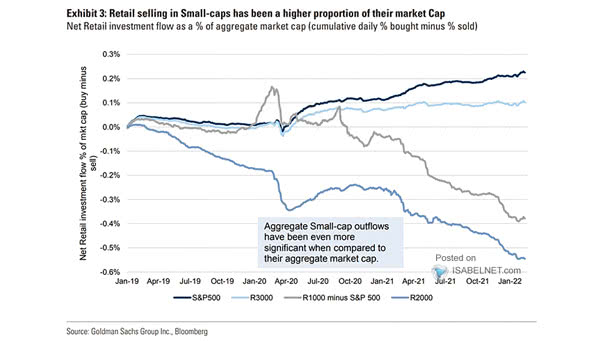
Net Retail Investment Flow as a % of Aggregate Market Capitalization Aggregate small-cap outflows by retail investors have been significant compared to their aggregate market capitalization. Image: Goldman Sachs Global Investment Research
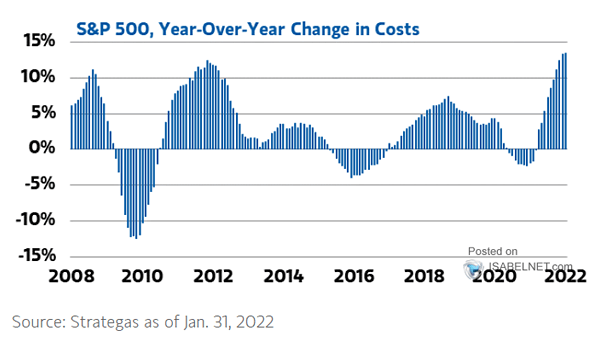
S&P 500 – YoY Change in Costs The growth rate of corporate costs is very high. Should investors expect a margin squeeze? Image: Morgan Stanley Wealth Management
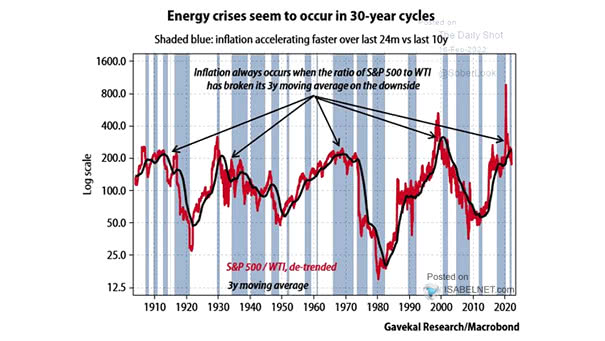
Inflation – S&P 500/WTI Could the United States face an energy crisis? Image: Gavekal, Macrobond
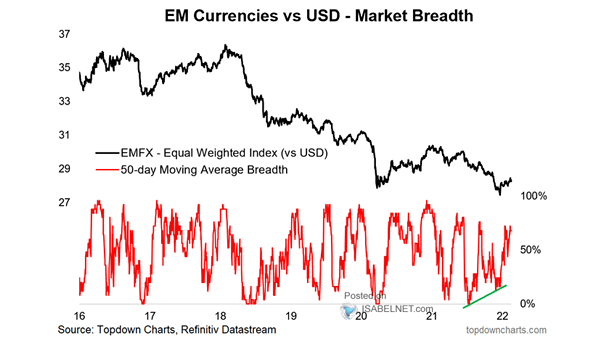
EM Currencies vs U.S. Dollar – Market Breadth The bullish breadth divergence suggests a potential upside among EM currencies. Image: Topdown Charts
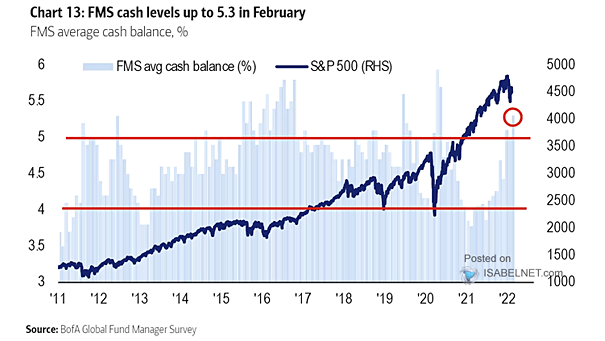
FMS Cash Balance and S&P 500 FMS cash levels jumped to 5.3% in February, which is contrarian bullish. Image: BofA Global Fund Manager Survey
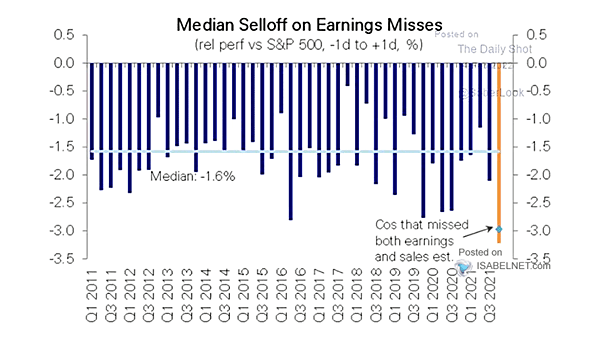
Median Sell-Off on Earnings Misses U.S. companies that missed their earnings estimates have been severely punished. Image: Deutsche Bank