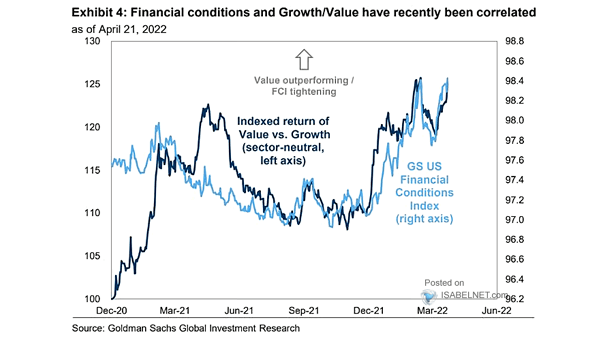
Indexed Return of Value vs. Growth vs. U.S. Financial Conditions
Indexed Return of Value vs. Growth vs. U.S. Financial Conditions Should investors still favor value over growth stocks? Image: Goldman Sachs Global Investment Research
Indexed Return of Value vs. Growth vs. U.S. Financial Conditions Should investors still favor value over growth stocks? Image: Goldman Sachs Global Investment Research
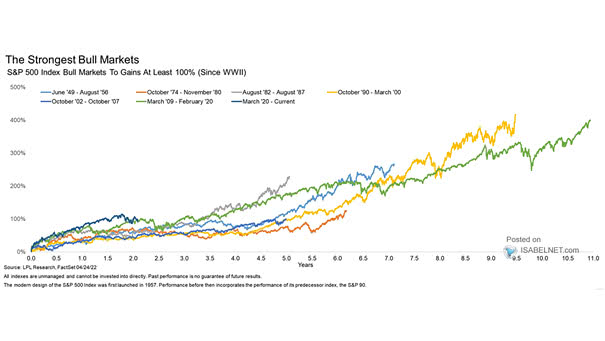
S&P 500 Index Bull Markets to Double Despite the recent sell-off, the current bull market remains one of the strongest ever. Image: LPL Research
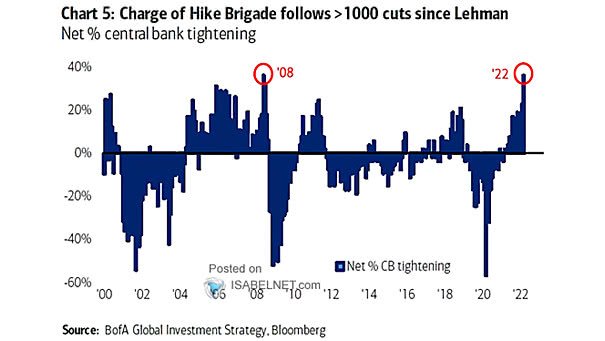
Net Percentage of Central Banks Tightening More central banks are hiking rates to compensate for rising inflation. Image: BofA Merrill Lynch Global Investment Strategy
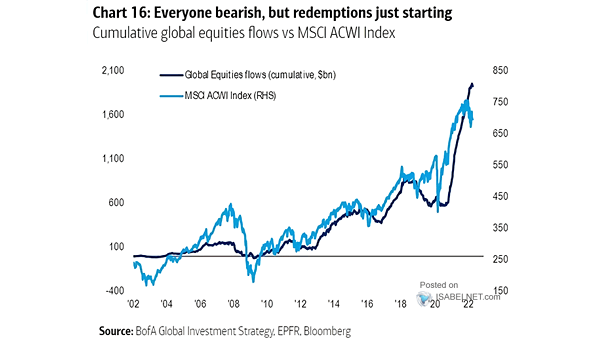
Cumulative Global Equities Flows vs. MSCI ACWI Index Global equities just saw massive outflows of $17.5 billion. Image: BofA Global Investment Strategy
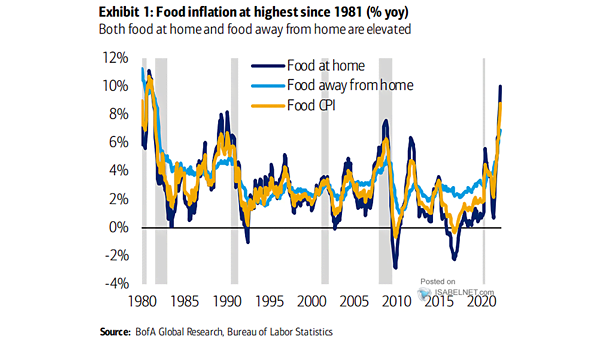
U.S. Inflation – Food at Home, Food Away from Home and Food CPI Food inflation is expected to remain high. Image: BofA Global Research
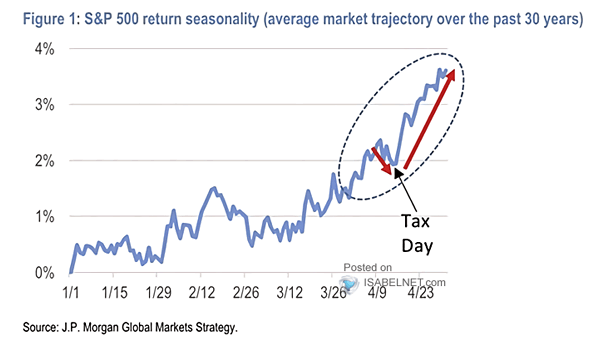
S&P 500 Return Seasonality and Tax Day Historically, U.S. stocks tend to rally in the two-week period after tax day. Image: J.P. Morgan
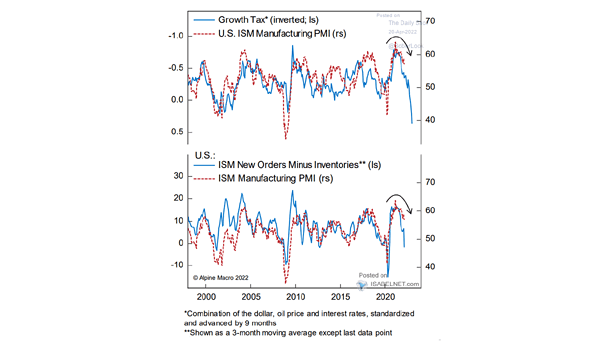
U.S. ISM Manufacturing PMI vs. Growth Tax (Inverted) vs. ISM New Orders Minus Inventories (Leading Indicator) Should investors expect a sharp fall in the U.S. ISM Manufacturing PMI? Image: Alpine Macro
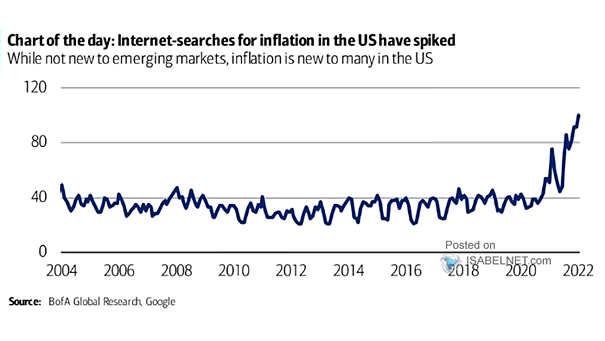
Internet-Searches for Inflation in the U.S. Americans’ fears about inflation are high, as Google search activity for “inflation” in the United States continues to rise. Image: BofA Global Research
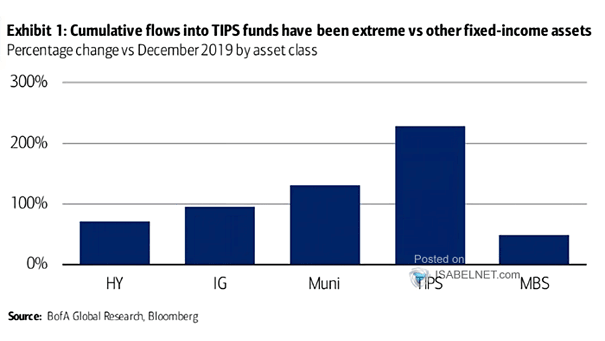
Flows – Fixed-Income Assets Flows into Treasury-Inflation Protected Securities (TIPS) funds have been very strong, as they offer investors protection against rising inflation. Image: BofA Global Research
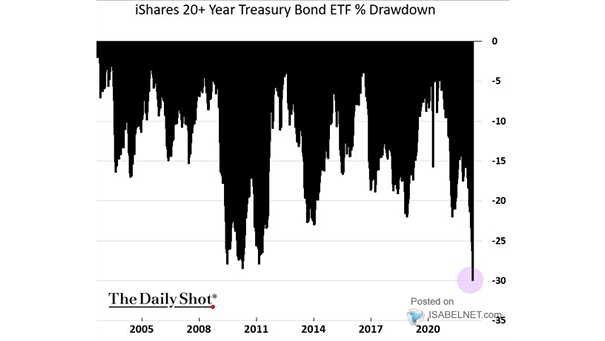
Returns – 20+ Year Treasury Bond ETF Drawdown Should investors consider long-maturity Treasuries after the market selloff? Image: The Daily Shot
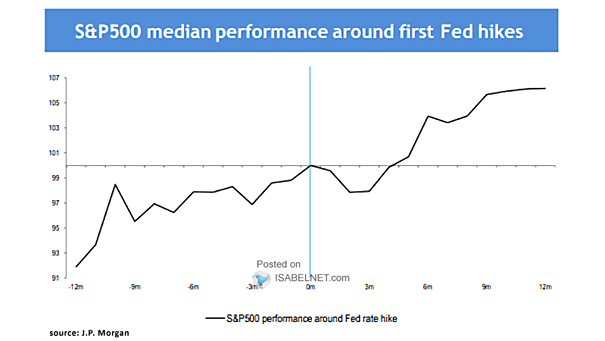
S&P 500 Median Performance Around First Fed Rate Hikes Historically, the S&P 500 tends to do well during Fed rate hike cycles. Image: J.P. Morgan