Inflation – U.S. Wholesale Used Vehicule Price Index
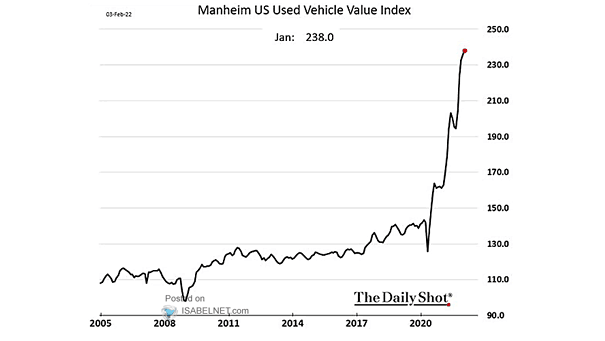
Inflation – U.S. Wholesale Used Vehicule Price Index Does transitory inflation take time? Used car prices in the United States continue to skyrocket. Image: The Daily Shot
Inflation – U.S. Wholesale Used Vehicule Price Index Does transitory inflation take time? Used car prices in the United States continue to skyrocket. Image: The Daily Shot
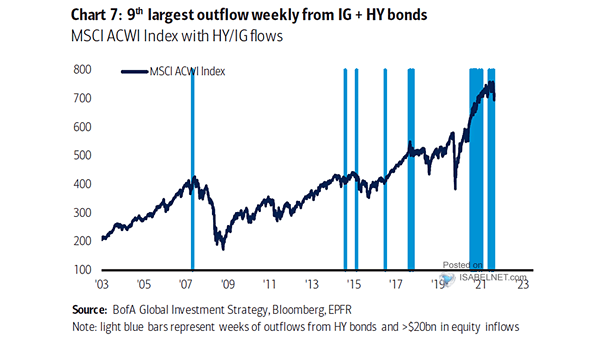
Global Equity Markets – MSCI ACWI Index with HY/IG Flows BofA sees a rates shock this year and remains bearish on equities and credit. Image: BofA Global Investment Strategy
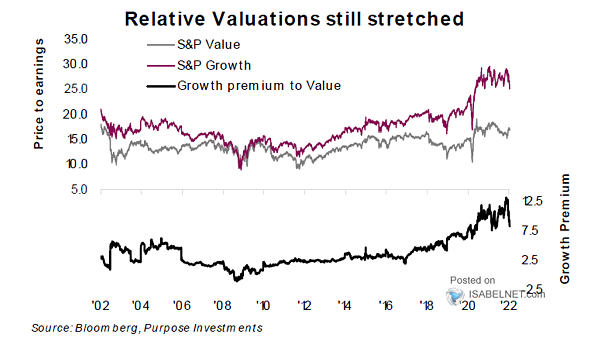
Valuation – S&P Growth vs. S&P Value Should investors continue to favor value stocks relative to growth stocks? Image: Richardson Wealth
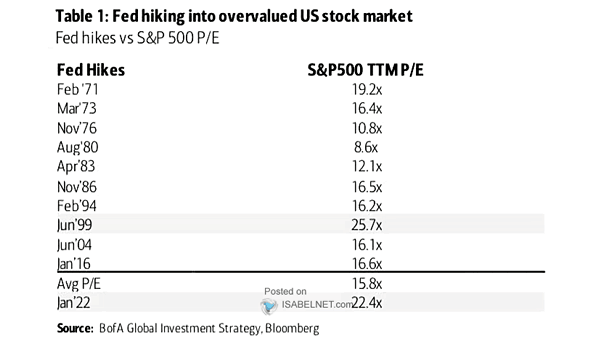
Valuation – Fed Rate Hikes vs. S&P 500 P/E Is the U.S. stock market facing strong headwinds at the start of the Fed’s hiking cycle? Image: BofA Global Investment Strategy
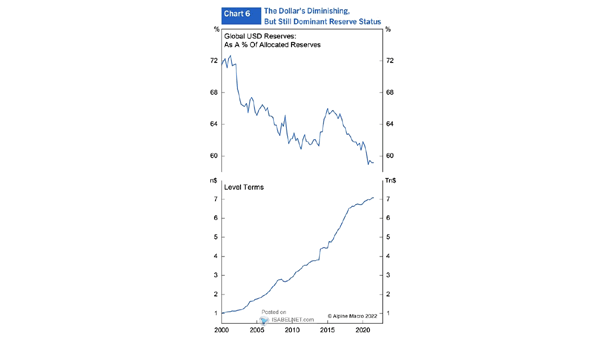
Global U.S. Dollar Reserves Will global U.S. dollar reserves continue to decrease over time? Image: Alpine Macro
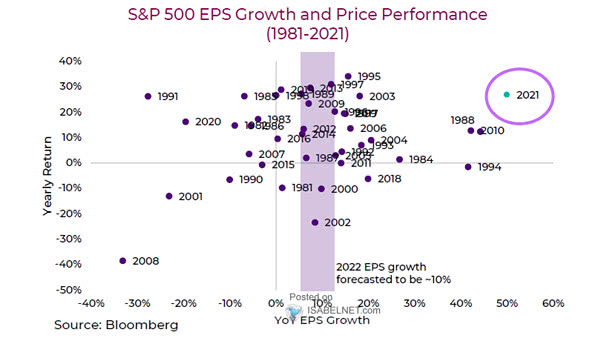
S&P 500 EPS Growth and Price Performance 2021 will be remembered as a year of strong earnings growth and S&P500 returns. Image: Richardson Wealth
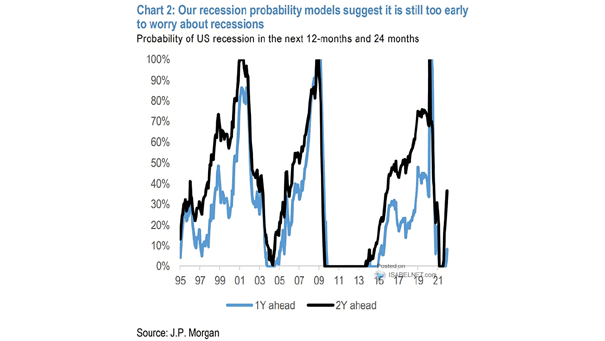
Probability of U.S. Recession in the Next 12 Months and 24 Months The probability of a U.S. recession in the next 24 months is increasing. Image: J.P. Morgan
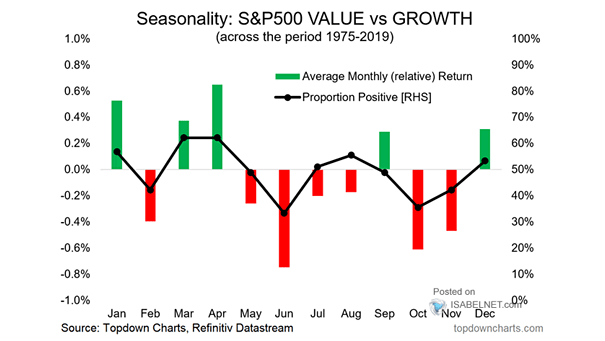
Seasonality – S&P 500 Value vs. Growth (Monthly Average Returns) Historically, returns for Value vs. Growth tend to be negative in February. Image: Topdown Charts
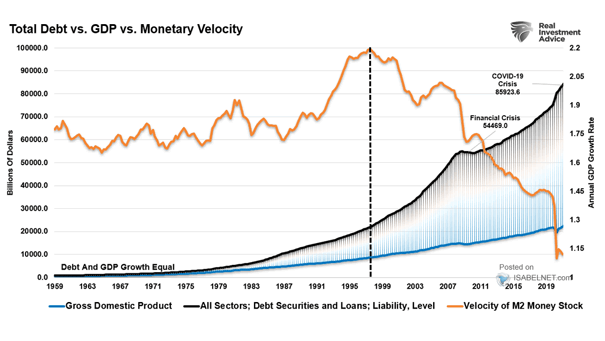
Total Debt vs. U.S. GDP vs. Monetary Velocity The rise in debt has coincided with a collapse in M2 velocity. Image: Real Investment Advice
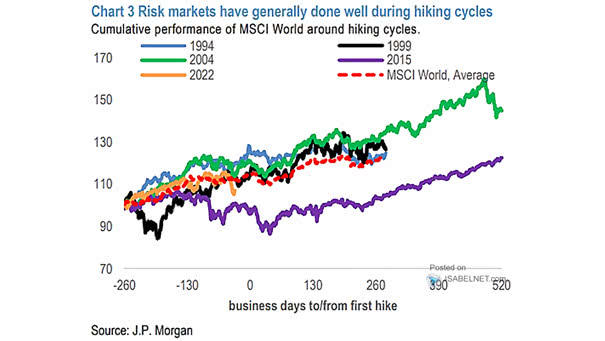
Cumulative Performance of MSCI World Around Hiking Cycles Historically, global equity markets have performed well during hiking cycles. Image: J.P. Morgan
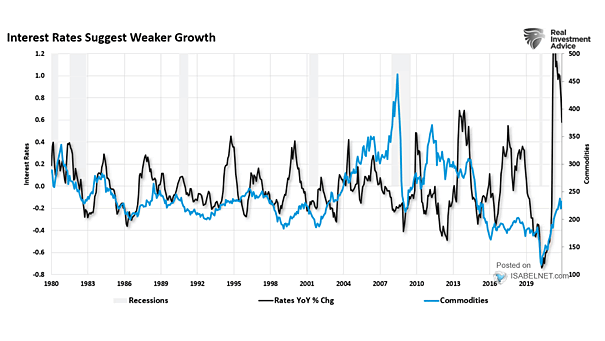
Interest Rates and Commodity Prices Commodity prices and interest rates have an inverse relationship. Is the commodity run over? Image: Real Investment Advice