Tech Stocks – Top-10 Nasdaq Sell-Offs in January
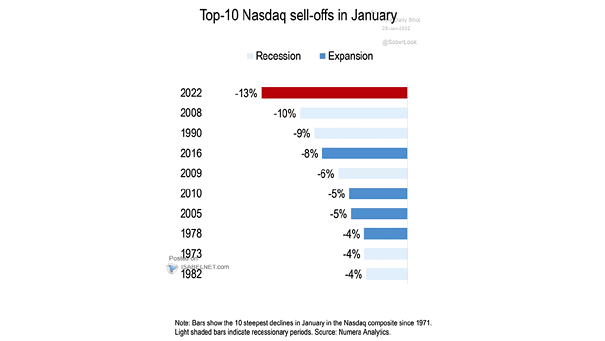
Tech Stocks – Top-10 Nasdaq Sell-Offs in January Is the Nasdaq sell-off overdone? Image: Numera Analytics
Tech Stocks – Top-10 Nasdaq Sell-Offs in January Is the Nasdaq sell-off overdone? Image: Numera Analytics
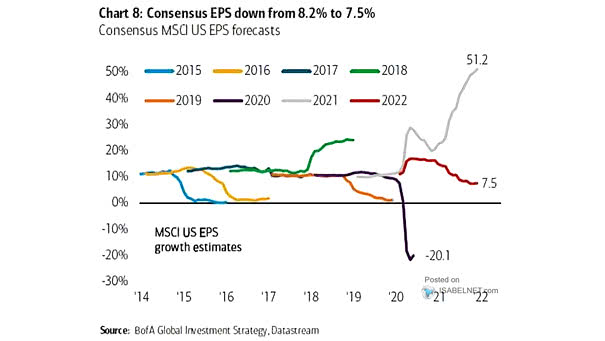
Consensus MSCI U.S. EPS Forecasts Consensus expects U.S. EPS growth at 7.5% this year. Image: BofA Global Investment Strategy
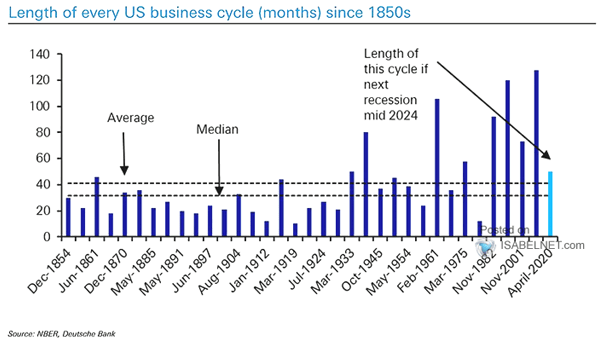
Recession – Length of Every U.S. Business Cycle If the next U.S. recession occurs in mid-2024, it will be the 8th longest cycle out of 35 since 1850s. Image: Deutsche Bank
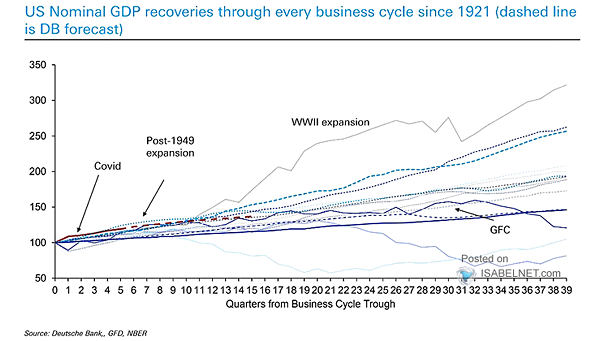
U.S. Nominal GDP Recoveries Through Every Business Cycle The current U.S. nominal GDP recovery is one the quickest in history. Image: Deutsche Bank
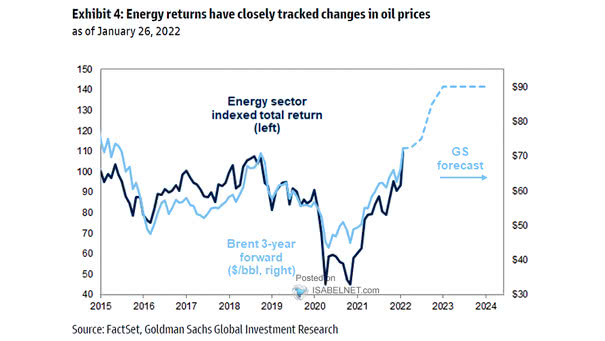
Energy Sector Indexed Total Return and Brent Crude Oil 3-Year Forward The energy sector is expected to rise further this year. Image: Goldman Sachs Global Investment Research
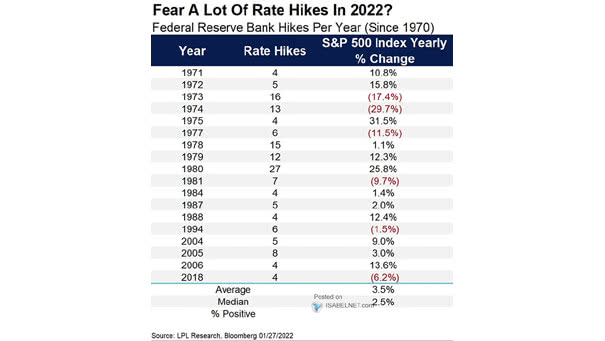
Interest Rates – S&P 500 Index and Federal Reserve Bank Rate Hikes per Year Historically, if the U.S. economy isn’t in a recession, the S&P 500 tends to do well during Fed rate hikes. Image:…
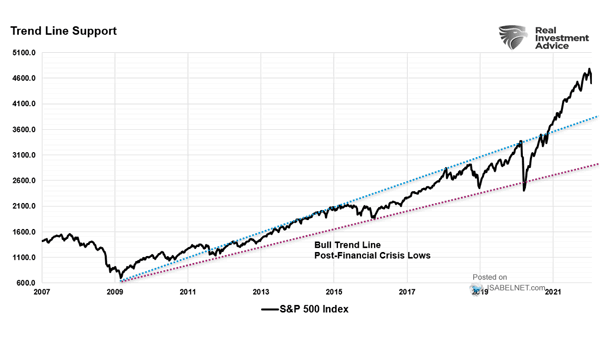
S&P 500 Index and Trend Line Support A drawdown to the long-term trendline from the 2009 lows would be painful for U.S. equity investors. Image: Real Investment Advice
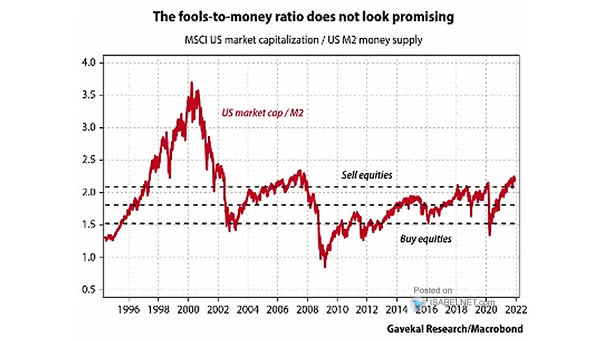
Valuation – MSCI U.S. Market Capitalization / U.S. M2 Money Supply Should investors take a cautious approach to the U.S. stock market? Image: Gavekal, Macrobond
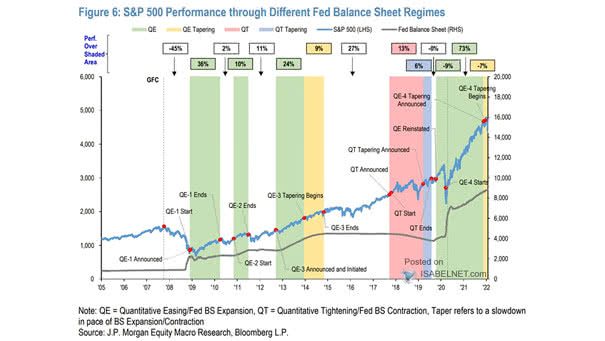
S&P 500 Performance Through Different Fed Balance Sheet Regimes U.S. equity investors should not worry too much about the Fed’s balance sheet reduction. Image: J.P. Morgan Equity Macro Research
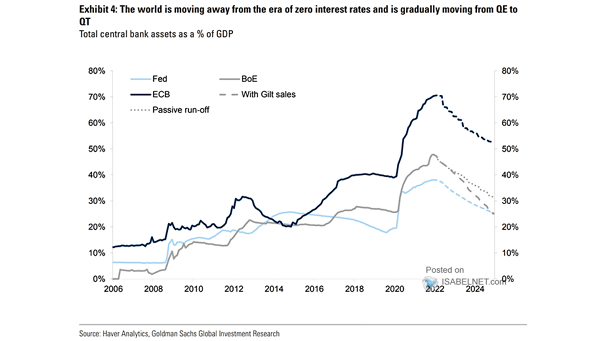
Total Central Bank Assets as a % of GDP The pace of major central bank purchases is expected to turn negative. Image: Goldman Sachs Global Investment Research
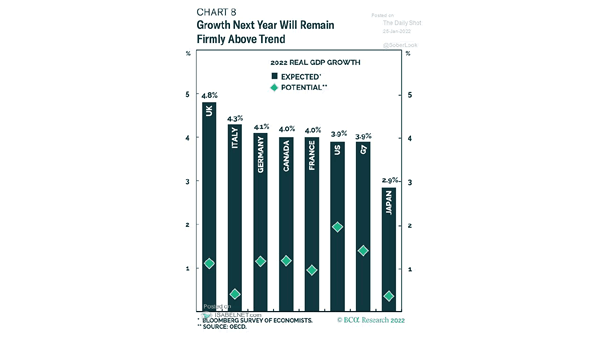
Real GDP Growth Real GDP growth is expected to remain well above the average in 2022. Image: BCA Research