Interest Rates – Fed Rate Hikes by Meeting
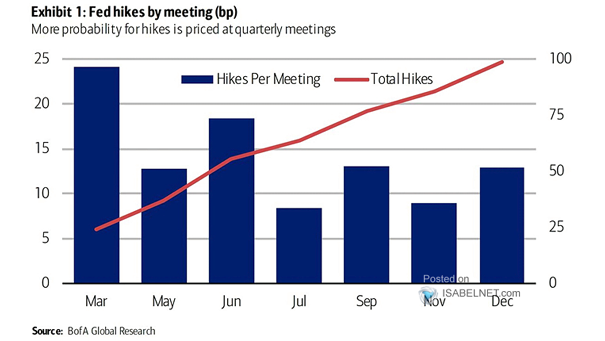
Interest Rates – Fed Rate Hikes by Meeting Should investors expect the federal funds rate to be at 2% in January 2023? Image: BofA Global Research
Interest Rates – Fed Rate Hikes by Meeting Should investors expect the federal funds rate to be at 2% in January 2023? Image: BofA Global Research
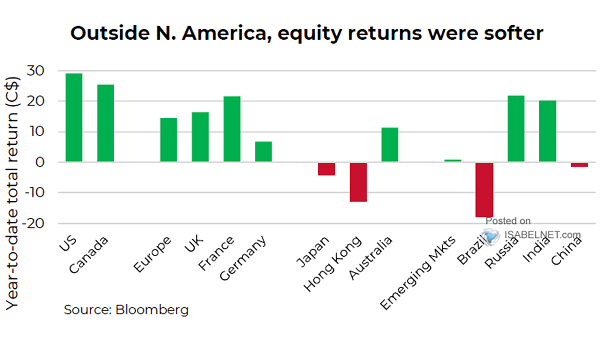
Equity Total Returns Geographic diversification hurt equity performance last year. Image: Richardson Wealth
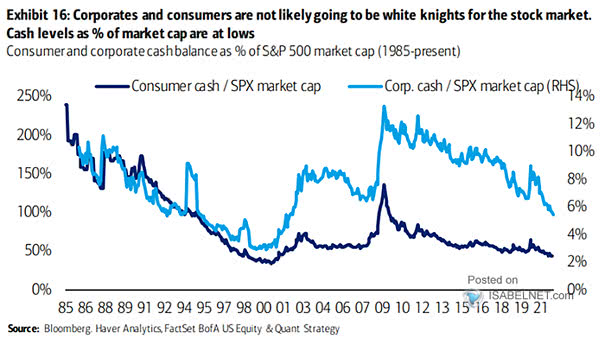
Consumer and Corporate Cash Balance as % of S&P 500 Market Capitalization Consumer and corporate cash levels as % of market capitalization are at lows. Is the U.S. stock market facing a lack of dry…
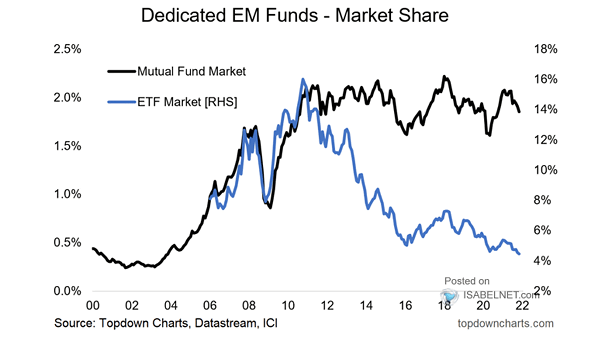
Dedicated Emerging Market Funds – Market Share EM ETF market share is at a record low, while long-term valuations are attractive. Image: Topdown Charts
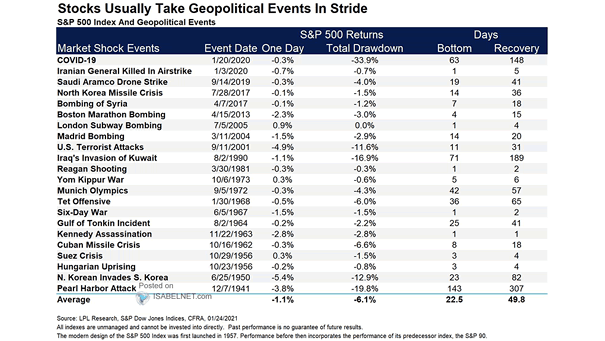
S&P 500 Drawdown – Geopolitical Events and Stock Market Reactions Historically, the impact of geopolitical events on U.S. stocks has tended to be short-lived. Image: LPL Research
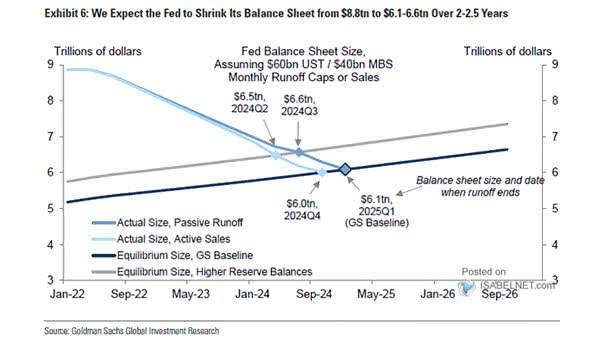
Fed Balance Sheet Size Will the Fed start reducing its balance sheet this year? Image: Goldman Sachs Global Investment Research
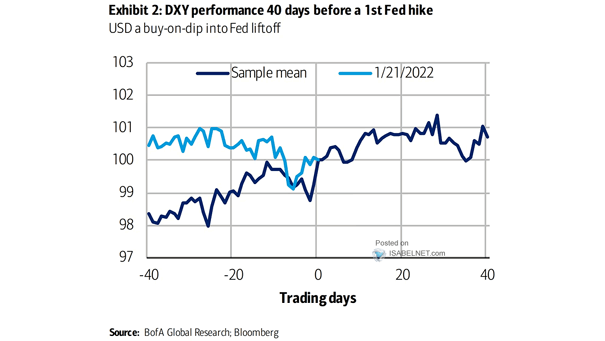
U.S. Dollar Performance 40 Days Before a First Fed Rate Hike Will the U.S. dollar continue to rise before the Fed’s first rate hike? Image: BofA Global Research
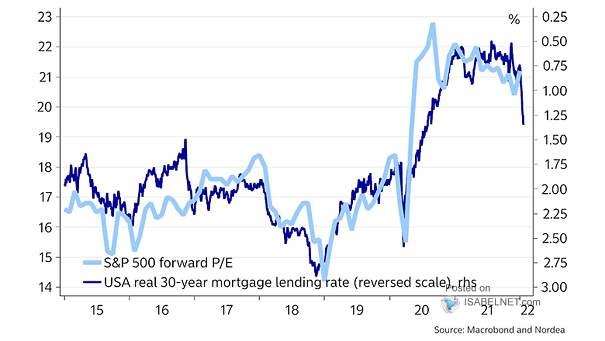
Valuation – S&P 500 Forward P/E and U.S. Real 30-Year Mortgage Lending Rate Should investors expect U.S. equity valuations to fall? Image: Nordea and Macrobond
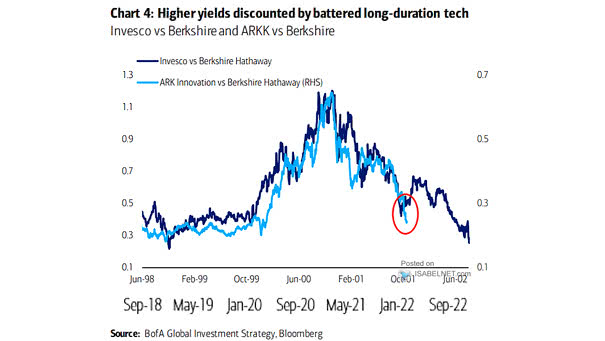
Tech Stocks – Invesco vs. Berkshire Hathaway and ARK Innovation vs. Berkshire Hathaway Will ARK Innovation ETF continue to decline? Image: BofA Global Investment Strategy
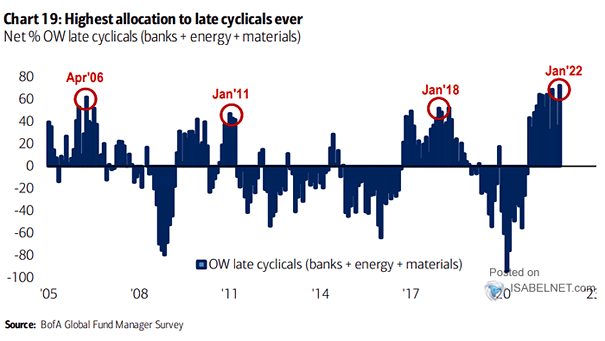
Value Stocks – Net % OW Late Cyclicals If inflation persists, should investors continue to look towards value and cyclical stocks? Image: BofA Global Fund Manager Survey
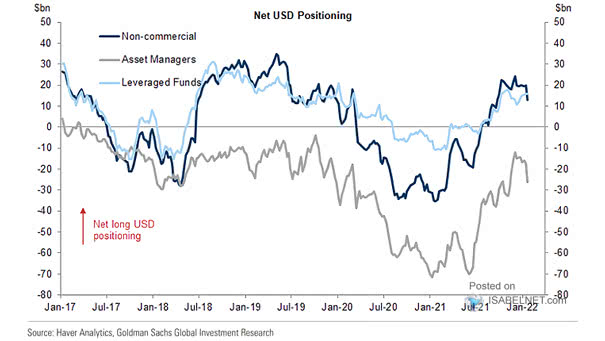
Net U.S. Dollar Positioning Asset managers have increased their net short positions in the U.S. dollar. Image: Goldman Sachs Global Investment Research