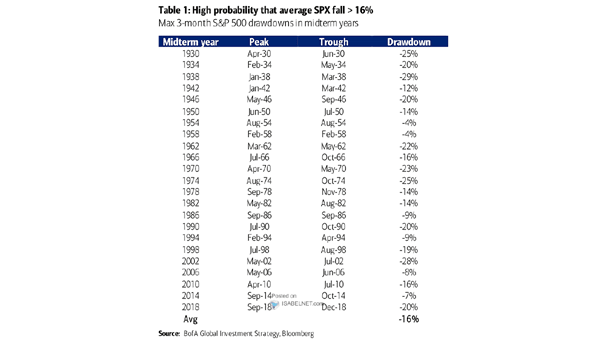
Max 3-Month S&P 500 Drawdowns in Midterm Election Years
Max 3-Month S&P 500 Drawdowns in Midterm Election Years Could the S&P 500 fall more than 16% this year? Image: BofA Global Investment Strategy
Max 3-Month S&P 500 Drawdowns in Midterm Election Years Could the S&P 500 fall more than 16% this year? Image: BofA Global Investment Strategy
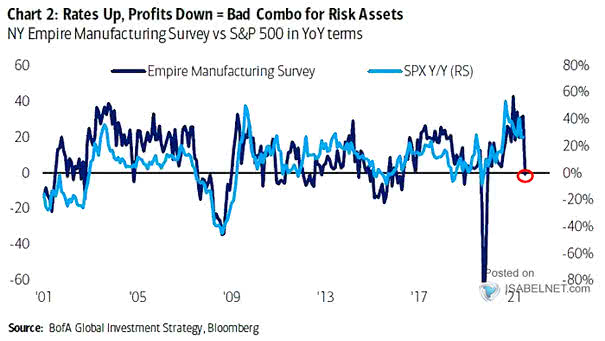
NY Empire Manufacturing Survey vs. S&P 500 YoY The NY Empire Manufacturing Survey turns negative. This does not bode well for the S&P 500. Image: BofA Global Investment Strategy
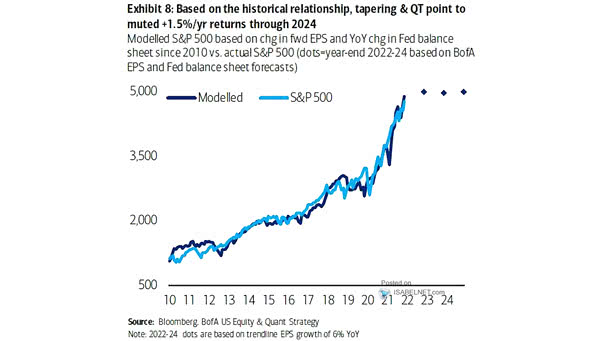
Returns – Modelled S&P 500 Based on Change in Forward EPS and YoY Change in Fed Balance Sheet vs. Actual S&P 500 Should investors expect anemic S&P 500 returns through 2024? Image: BofA US Equity…
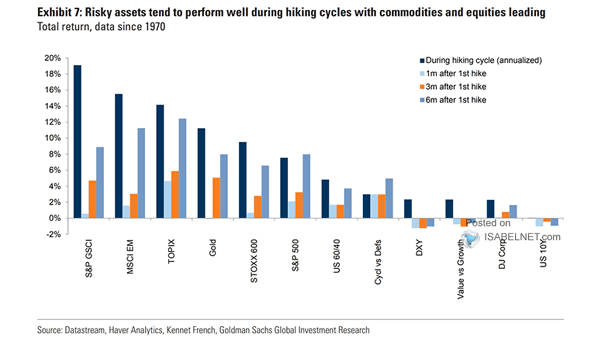
Asset Returns During Hiking Cycles Investors should worry when the Fed stops raising or cuts rates. Image: Goldman Sachs Global Investment Research
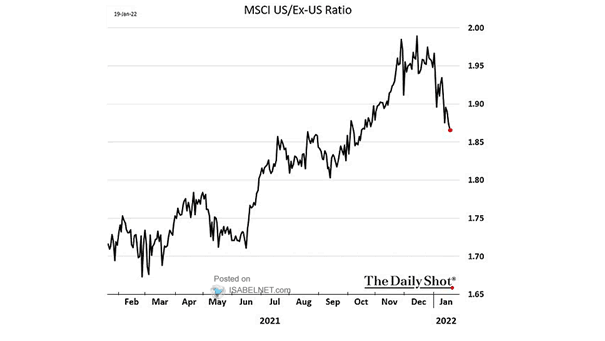
Equity – MSCI U.S./Ex-U.S. Ratio Are global equities ex-U.S. poised to outperform U.S. equities this year? Image: The Daily Shot
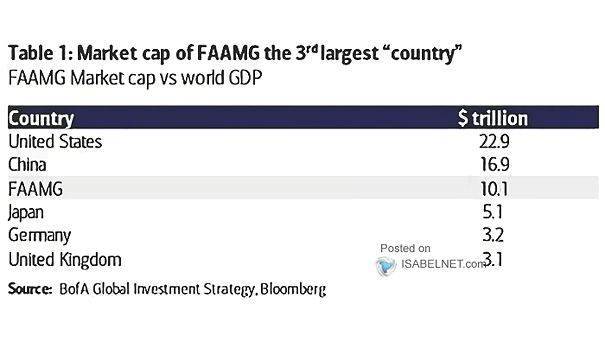
FAAMG Stocks – GDP by Country and FAAMG by Market Capitalization FAAMG (Facebook, Amazon, Apple, Microsoft, and Google) market capitalization exceeds $10 trillion and is equivalent to the 3rd largest GDP in world. Image: BofA…
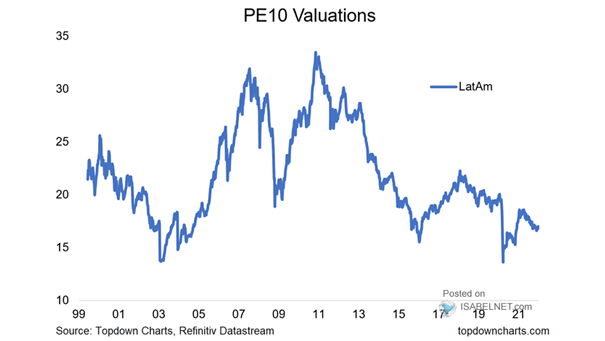
Latin American Stocks – PE10 Valuations Should long-term investors have Latin American stocks in their portfolios, as they are historically cheap? Image: Topdown Charts
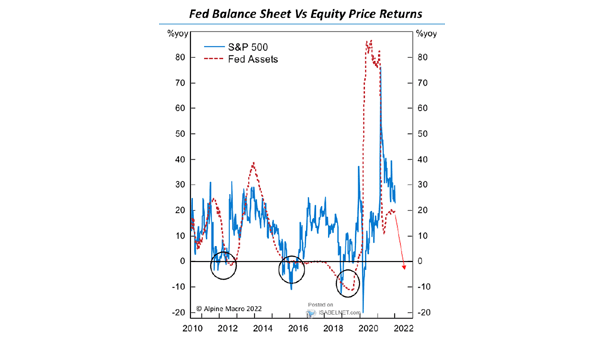
S&P 500 – Fed Balance Sheet vs. Equity Price Returns Could the Fed’s balance sheet reduction derail the U.S. stock market? Image: Alpine Macro
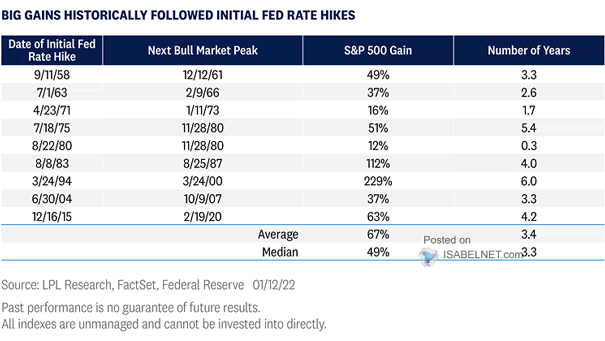
Bull Markets After Initial Fed Rate Hike Historically, the first Fed rate hike is not the end of the bull market. Image: LPL Research
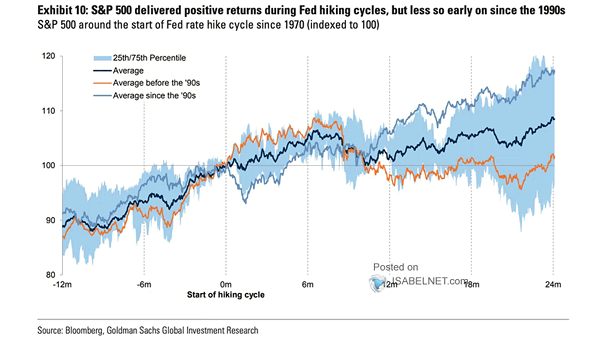
S&P 500 Around the Start of Fed Rate Hike Cycle Will the S&P 500 generate positive returns during the Fed’s hiking cycle? Image: Goldman Sachs Global Investment Research
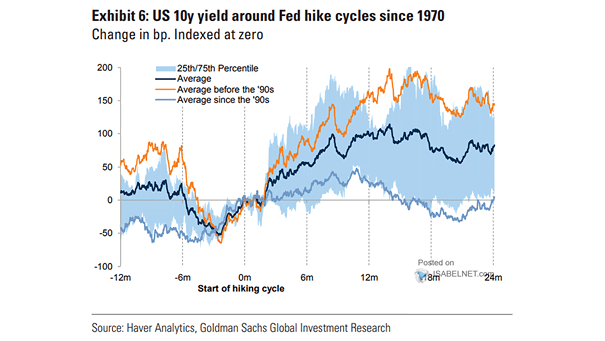
U.S. 10-Year Treasury Yield Around Fed Hike Cycles Historically, the U.S. 10-year Treasury yield tends to rise a few months before the start of the Fed’s hiking cycle. Image: Goldman Sachs Global Investment Research