S&P 500 Index Returns Under a Higher 10-Year Yield
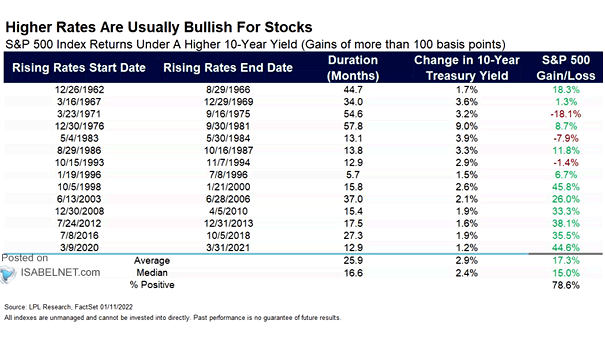
S&P 500 Index Returns Under a Higher 10-Year Yield Historically, higher rates tend to be bullish for the S&P 500. Image: LPL Research
S&P 500 Index Returns Under a Higher 10-Year Yield Historically, higher rates tend to be bullish for the S&P 500. Image: LPL Research
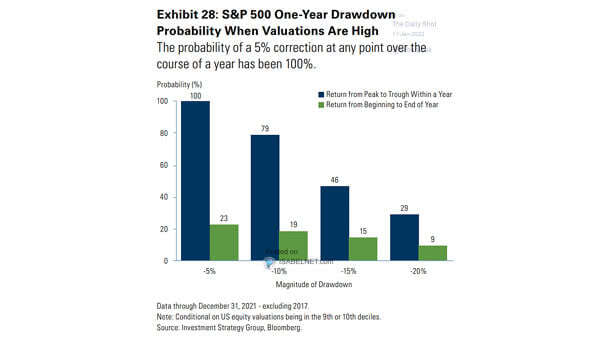
S&P 500 One-Year Drawdown Probability When Valuations Are High Is the S&P 500 poised for a large drawdown at some point this year? Image: Goldman Sachs Global Investment Research
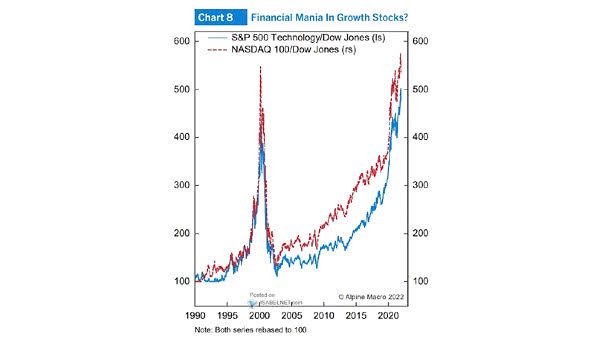
Stocks – S&P 500 Technology/Dow Jones and NASDAQ 100/Dow Jones Are tech stocks about to burst again like the dotcom bubble? Image: Alpine Macro
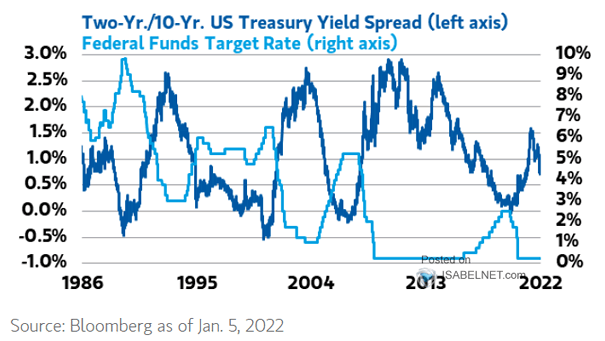
U.S. 10Y-2Y Yield Curve and Fed Funds Target Rate As the bond market has discounted the Fed’s hawkish policy stance, the U.S. yield curve may not flatten if growth remains resilient in 2022. Image: Morgan…
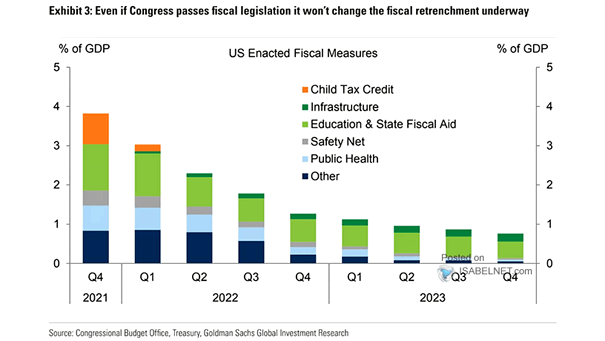
GDP – U.S. Enacted Fiscal Measures Goldman Sachs expects U.S. GDP to grow by 3.5% this year and 2.2% in 2023. Image: Goldman Sachs Global Investment Research
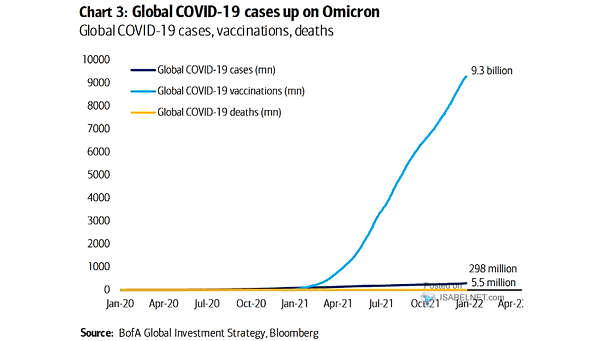
Coronavirus – Global COVID-19 Cases, Vaccinations and Deaths Global COVID-19 cases are rising, driven by the Omicron variant. Image: BofA Global Investment Strategy
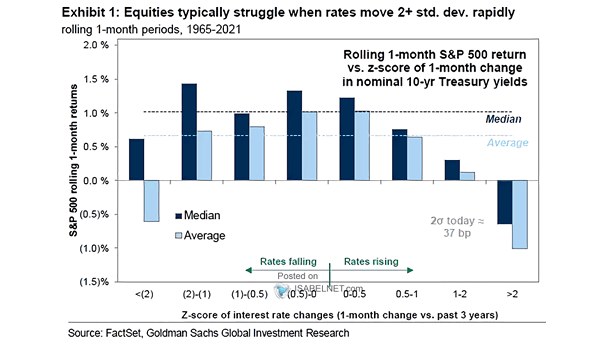
Rolling 1-Month S&P 500 Return vs. Z-score of 1-Month Change in 10-Year U.S. Treasury Yields When U.S. Treasury yields increase too fast, the S&P 500 tends to struggle. Image: Goldman Sachs Global Investment Research
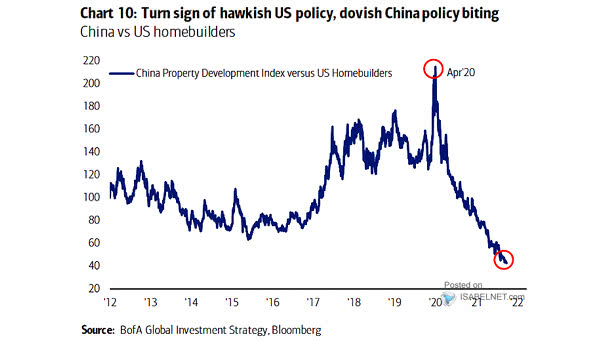
Monetary Policy – China vs. U.S. Homebuilders China and the United States are expected to diverge on monetary policy this year. Image: BofA Global Investment Strategy
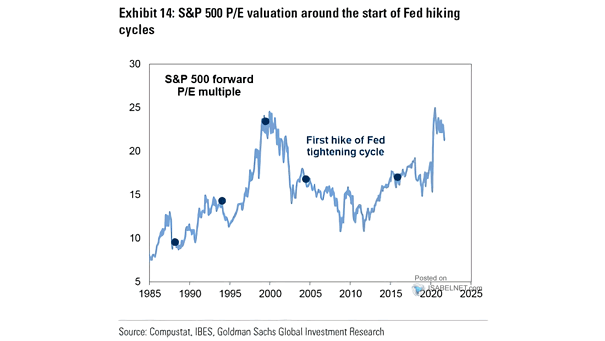
Valuation – S&P 500 Forward P/E Multiple and First Hike of Fed Tightening Cycle Historically, the S&P 500 forward P/E remains flat in the 6 months before and after the start of the first Fed…
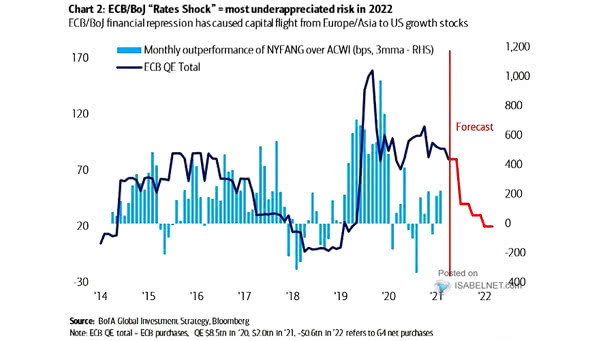
Monthly Outperformance of NYFANG Over ACWI and ECB QE Total Is the shock of central bank tightening in Europe and Japan the most underappreciated risk this year? Image: BofA Global Investment Strategy
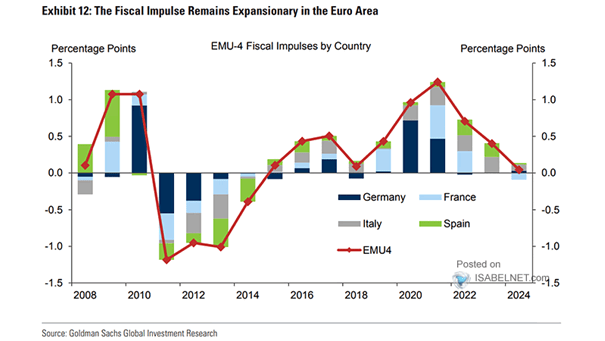
Fiscal Impulses in the Euro Area The fiscal impulse in the euro area is expected to remain expansionary. Image: Goldman Sachs Global Investment Research