Federal Funds Target Rate vs. Atlanta Fed Median Wage Growth
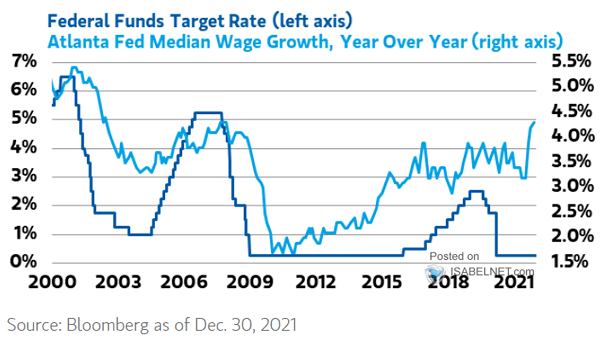
Federal Funds Target Rate vs. Atlanta Fed Median Wage Growth Is the Fed behind the curve on wage growth? Image: Morgan Stanley Wealth Management
Federal Funds Target Rate vs. Atlanta Fed Median Wage Growth Is the Fed behind the curve on wage growth? Image: Morgan Stanley Wealth Management
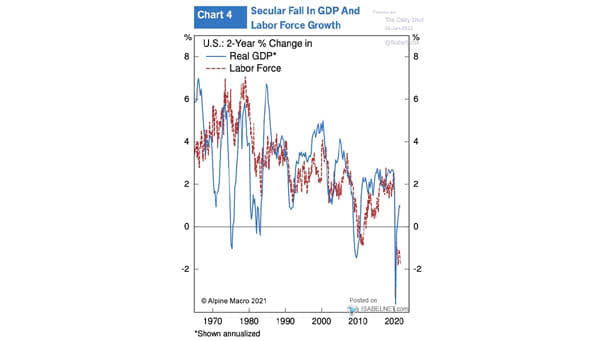
U.S. Real GDP and Labor Force Is slower economic growth in the United States the new normal? Image: Alpine Macro
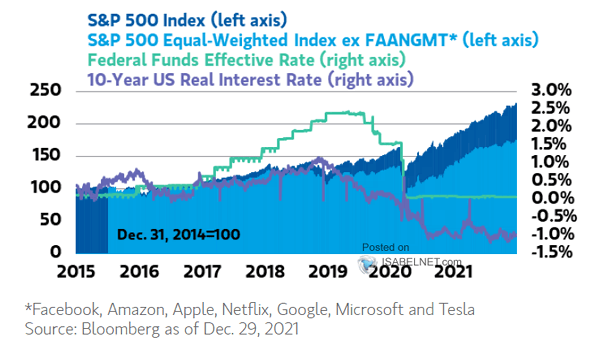
S&P 500 Index and 10-Year U.S. Real Interest Rates With Fed funds on the move, a rise in real rates could become a strong headwind for the S&P 500. Image: Morgan Stanley Research
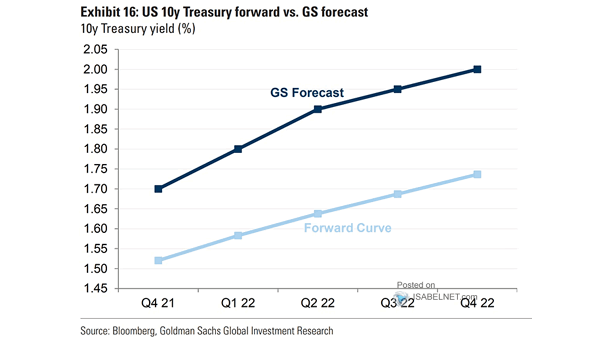
U.S. 10-Year Treasury Yield Forward Curve vs. Forecast Goldman Sachs forecasts the U.S. 10-year Treasury yield at 2.00% by the end of 2022. Image: Goldman Sachs Global Investment Research
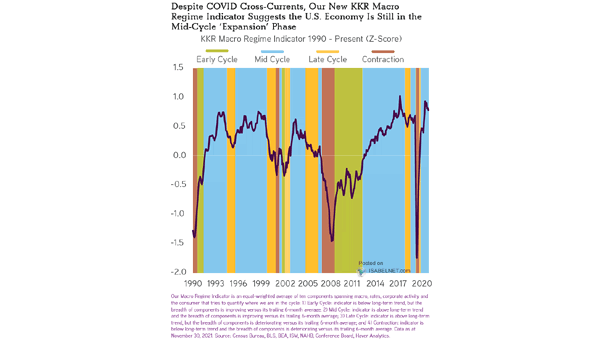
U.S. Cycle – Macro Regime Indicator The KKR’s macro regime indicator is still in the mid-cycle expansion phase. Image: KKR & Co.
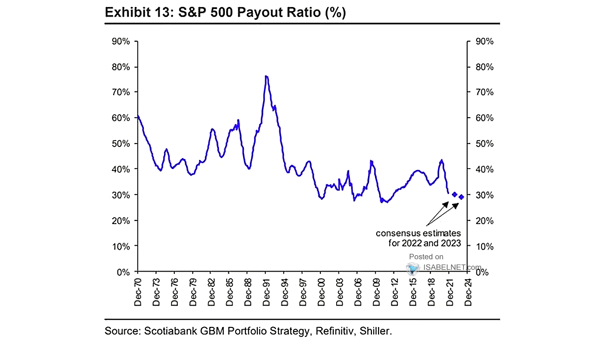
S&P 500 Dividend Payout Ratio Despite a high dividend payout ratio, the S&P 500 dividend yield is near historic lows at 1.3%. Image: Scotiabank GBM Portfolio Strategy
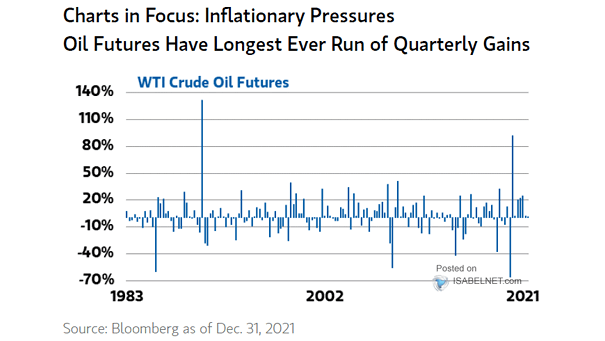
Inflationary Pressures – WTI Crude Oil Futures Will oil prices continue to rise in 2022? Image: Morgan Stanley Research
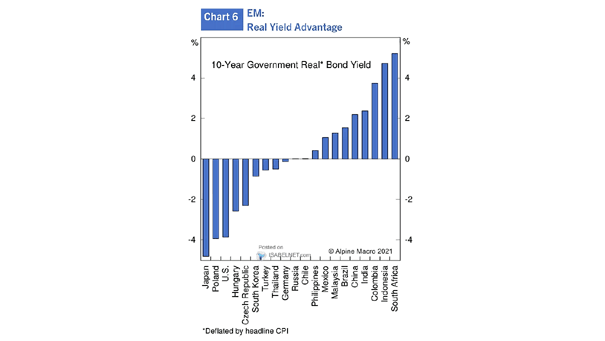
10-Year Government Real Bond Yield Some emerging markets still have positive 10-year government real bond yields. Image: Alpine Macro
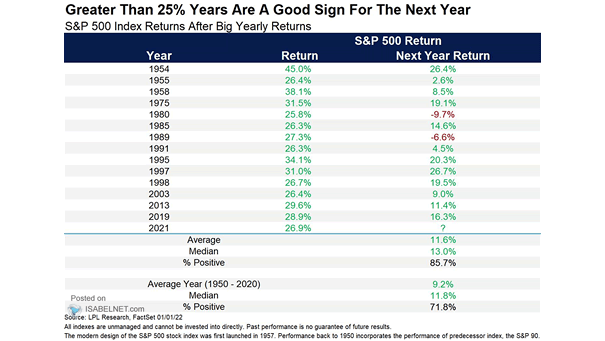
S&P 500 Index Returns After Big Yearly Returns When the S&P 500 is up more than 25% at the end of the year, the following year tends to be bullish for U.S. stocks. Image: LPL…
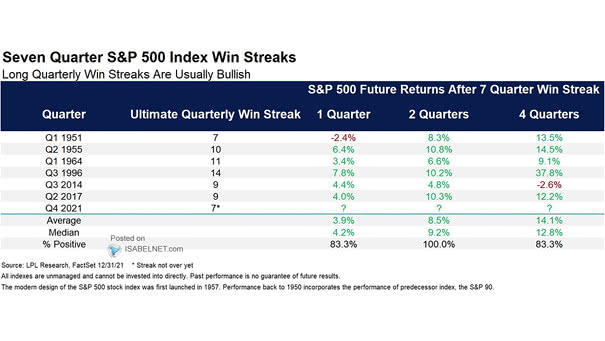
S&P 500 Future Returns After 7 Quarter Win Streak Historically, 7 quarter S&P 500 win streaks tend to be bullish for U.S. stocks. Image: LPL Research
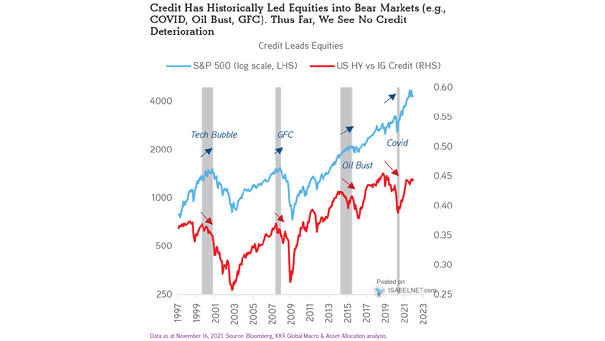
S&P 500 and U.S. HY vs. IG Credit No credit deterioration is an overall positive sign for the U.S. bull market, as credit tends to lead equities. Image: KKR & Co.