December and January Seasonality
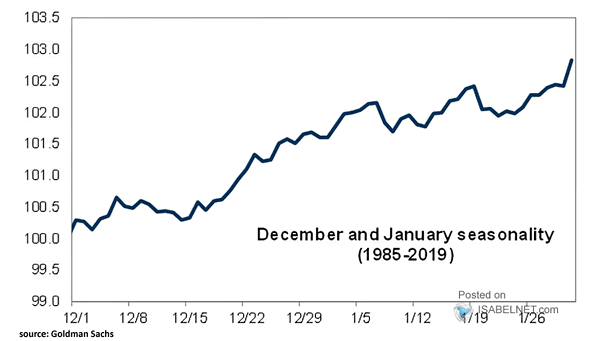
December and January Seasonality Historically, December and January have been strong months since 1985. Image: Goldman Sachs Global Investment Research
December and January Seasonality Historically, December and January have been strong months since 1985. Image: Goldman Sachs Global Investment Research
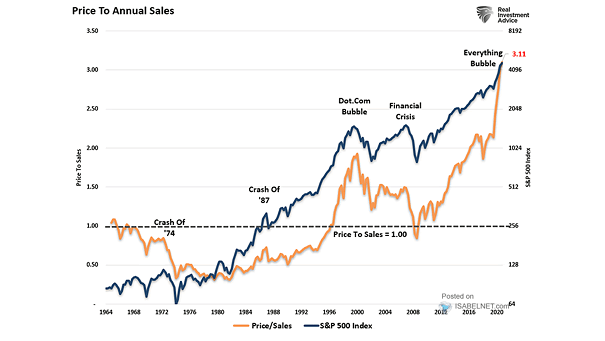
Valuation – S&P 500 Index and Price to Annual Sales Measured by price to annual sales, U.S. stocks are looking more and more expensive. Should investors take a cautious approach to U.S. equities in 2022?…
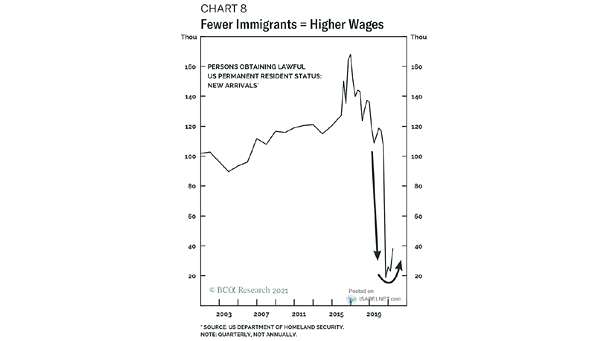
Wages and Immigrants in the United States Less supply of immigrants in the United States tends to increase wages. Image: BCA Research
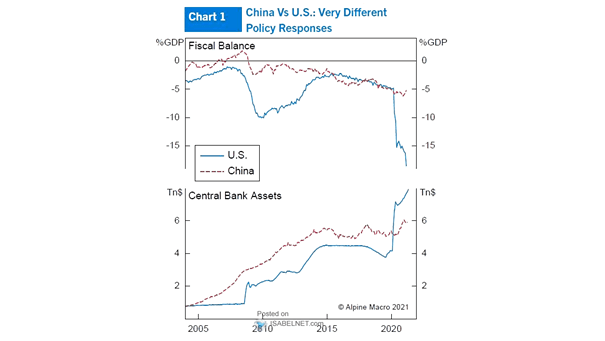
US vs. China – Fiscal Balance and Central Bank Assets As the chart shows, the U.S. and China have two very different policy responses to the pandemic crisis. Image: Alpine Macro
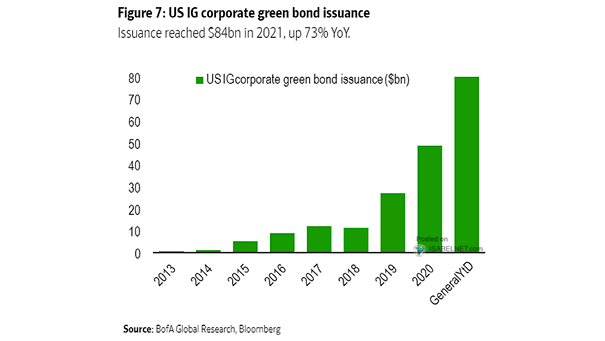
U.S. IG Corporate Green Bond Issuance U.S. IG corporate green bond issuance reached $84 billion this year. Image: BofA Global Research
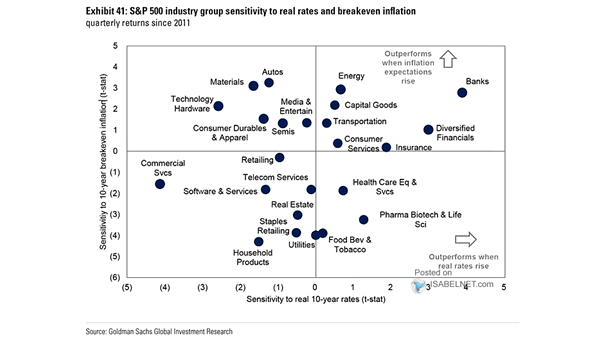
Returns – S&P 500 Industry Group Sensitivity to Real Rates and Breakeven Inflation Should investors overweight healthcare and financials for 2022? Image: Goldman Sachs Global Investment Research
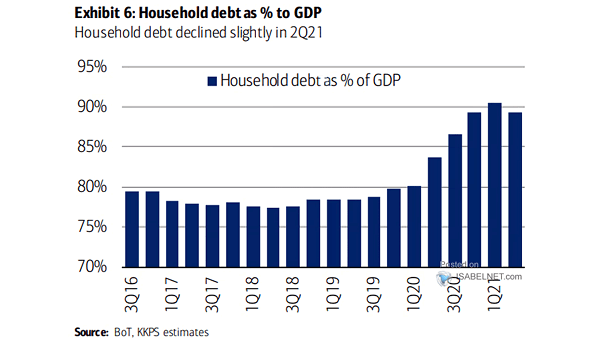
U.S. Household Debt as % of GDP The COVID-19 pandemic led to a spike in U.S. household debt as a % of GDP. Image: BofA Global Research
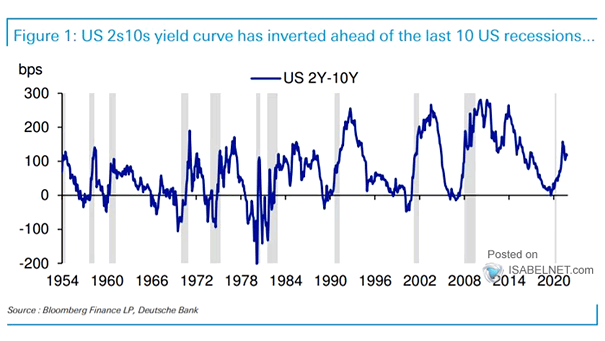
U.S. 10Y-2Y Yield Curve and Recessions Historically, an inverted yield curve has been an excellent indicator of a pending economic recession in the United States. Image: Deutsche Bank
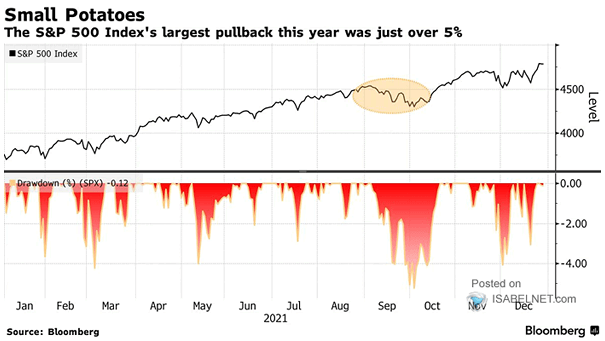
S&P 500 Index Pullback Investors were all-in on the U.S. stock market this year. Is a major pullback on the horizon? Image: Bloomberg
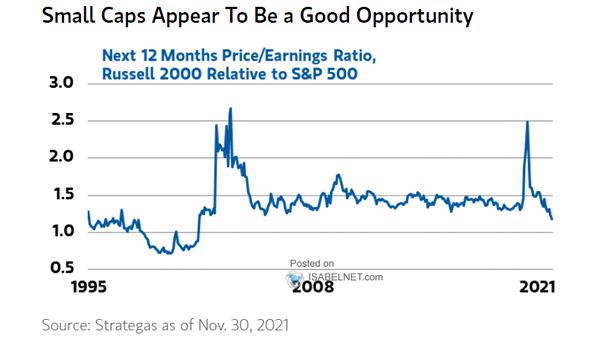
Small Cap Stocks – Next 12 Months Price/Earnings Ratio, Russell 2000 Relative to S&P 500 U.S. small caps look attractive relative to the broad market. Image: Morgan Stanley Research
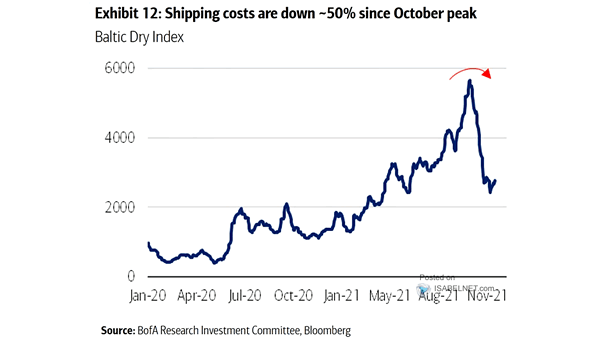
Baltic Dry Index – Dry Bulk Shipping Costs The Baltic Dry Index is now down 50% since the October peak. Image: BofA Research Investment Committee