Economic Growth vs. M2 Velocity
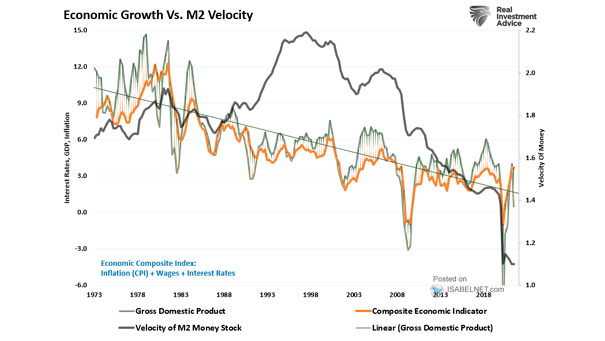
Economic Growth vs. M2 Velocity The decline in economic growth has coincided with a collapse in M2 velocity Image: Real Investment Advice
Economic Growth vs. M2 Velocity The decline in economic growth has coincided with a collapse in M2 velocity Image: Real Investment Advice
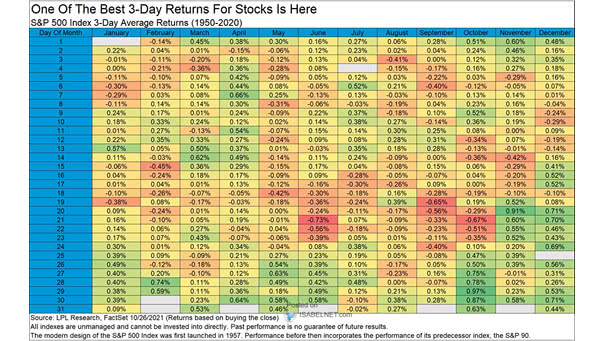
S&P 500 Index 3-Day Average Returns Are U.S. equity investors ready for a Santa Claus rally this year? Image: LPL Research Click the Image to Enlarge
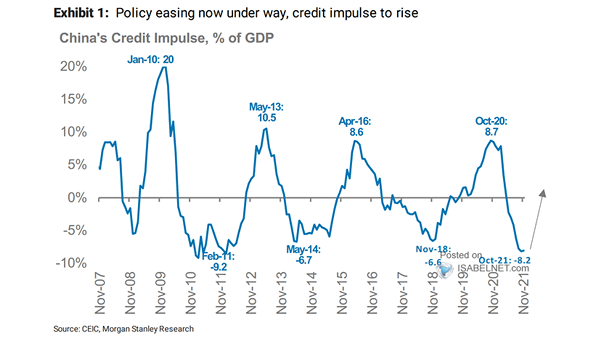
China’s Credit Impulse as % of GDP Investors should be pleased as Chinese credit impulse is expected to rise. Image: Morgan Stanley Research
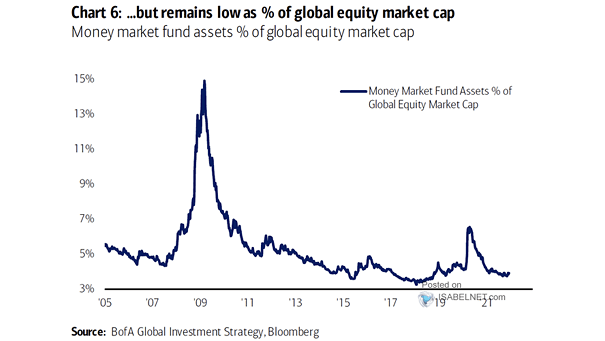
Money Market Funds Assets as a % of Global Equity Market Capitalization Cash has been rising in the last few months but remains low as a % of global equity market capitalization. Image: BofA Global…
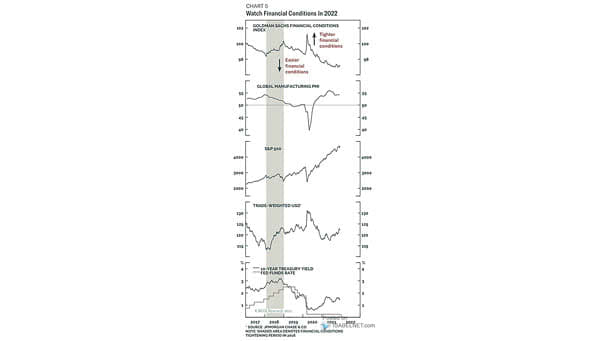
Markets – Financial Conditions, Global Manufacturing, PMI, S&P 500, U.S. Dollar, 10-Year UST Yield and Fed Fund Rates Should investors brace for tighter financial conditions in 2022? Image: BCA Research
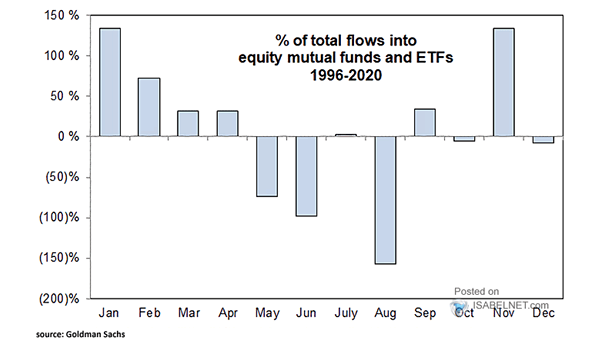
% of Total Flows into Equity Mutual Funds and ETFs since 1996 Historically, January tends to see strong equity inflows. Image: Goldman Sachs Global Investment Research
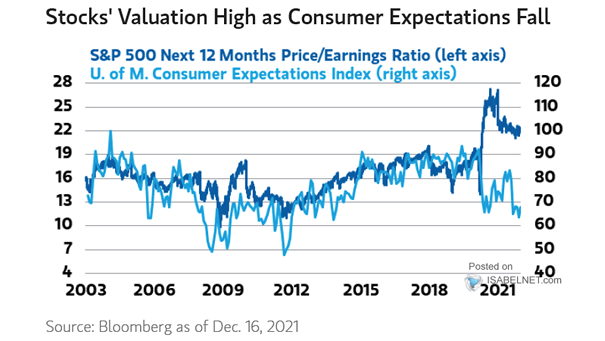
Valuation – S&P 500 Next 12 Months P/E Ratio vs. University of Michigan Consumer Expectations Index The valuation of the S&P 500 remains high as consumer expectations fall. Image: Morgan Stanley Wealth Management
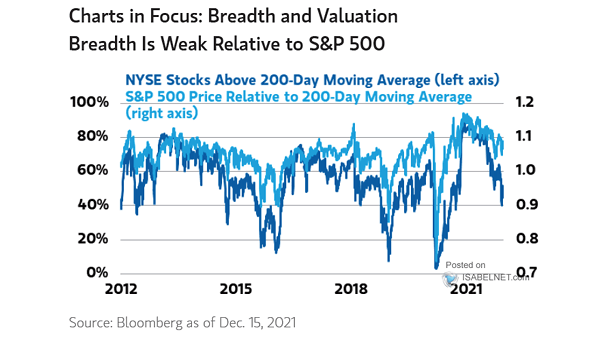
Stock Market Breadth – NYSE Stocks Above 200-DMA and S&P 500 Price Relative to 200-DMA Stock market breadth has worsened significantly over the last months. Image: Morgan Stanley Wealth Management
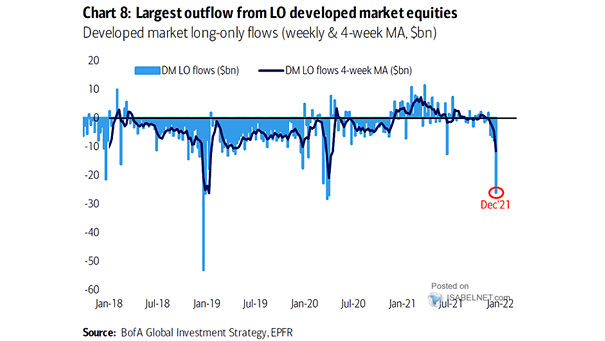
Developed Market Long-Only Flows Why do equity investors hit the sell button? Image: BofA Global Investment Strategy
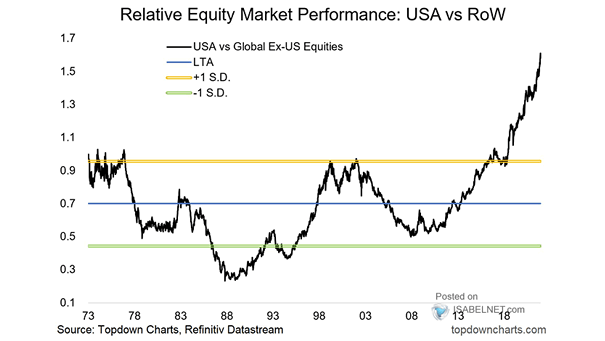
Relative Equity Market Performance – USA vs. Rest of the World How long will U.S. equities continue outperform the rest of the world? Image: Topdown Charts
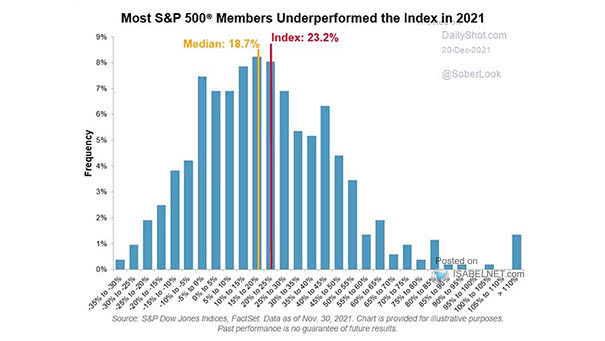
S&P 500 Members Why is the S&P 500 hard to beat this year? Image: S&P Global Market Intelligence