M2 / Equity Market Capitalization vs. S&P 500
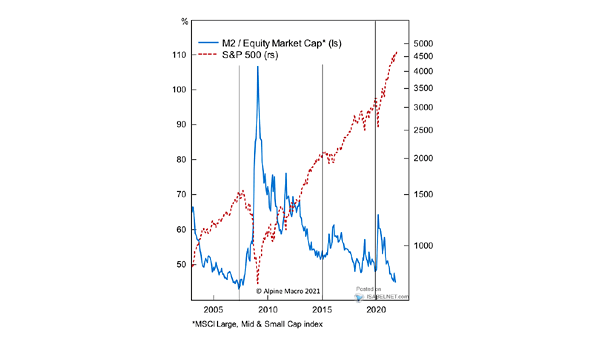
M2 / Equity Market Capitalization vs. S&P 500 Could a liquidity shortage send the S&P 500 lower? Image: Alpine Macro
M2 / Equity Market Capitalization vs. S&P 500 Could a liquidity shortage send the S&P 500 lower? Image: Alpine Macro
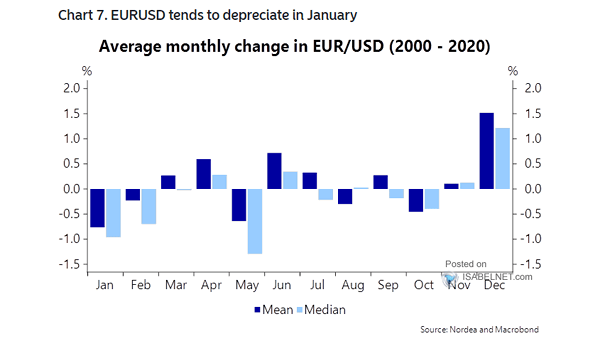
Seasonality – Average Monthly Change in EUR/USD Will EUR/USD fall in January 2022? Image: Nordea and Macrobond
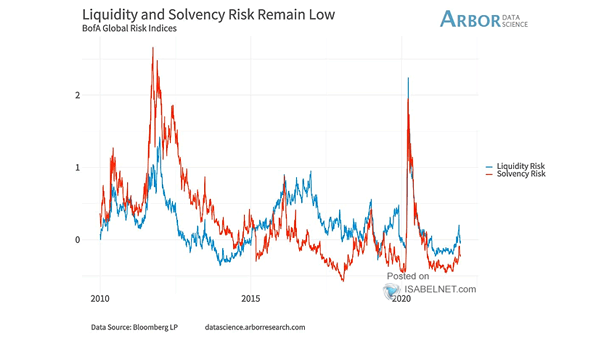
Liquidity and Solvency Risk Indices Liquidity and solvency risk indices remain low, which is good news for stocks. Image: Arbor Research & Trading LLC
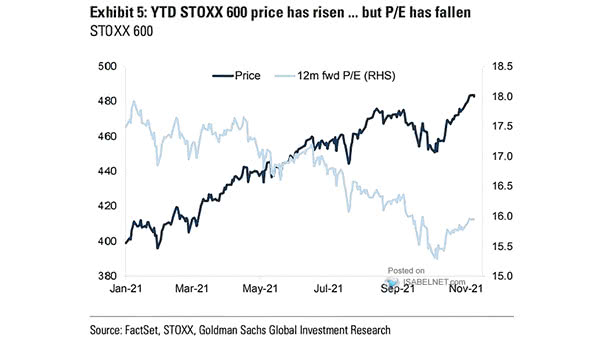
Valuation – Europe STOXX 600 12-Month Forward P/E European stocks still look cheaper than their U.S. counterparts. Image: Goldman Sachs Global Investment Research
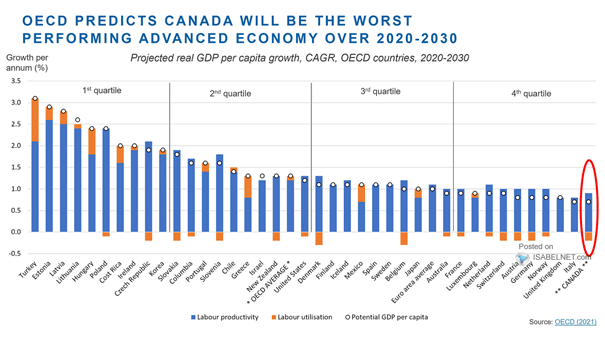
OECD Countries – Projected Real GDP per Capita Growth Canada is expected to be the worst performing advanced economy over 2020-2030. Image: OECD
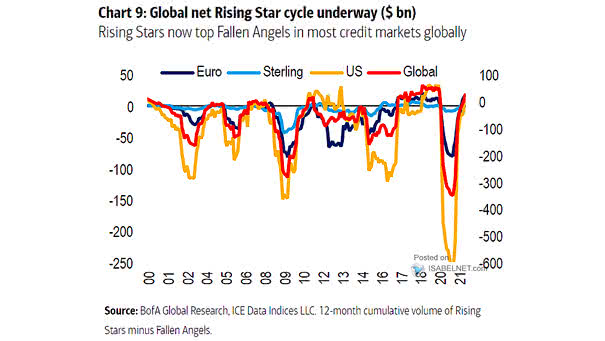
High Yield Bonds – 12-Month Cumulative Volume of Rising Stars Minus Fallen Angels BofA forecasts a total return of 4-5% for U.S. high-yield bonds in 2022. Image: BofA Global Research
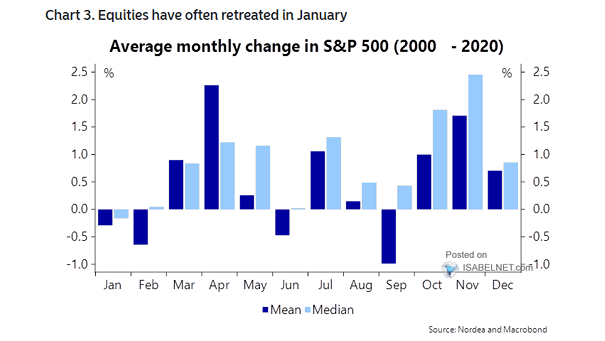
Seasonality – Average Monthly Change in S&P 500 Will January 2022 be a challenging month for U.S. equities? Image: Nordea and Macrobond
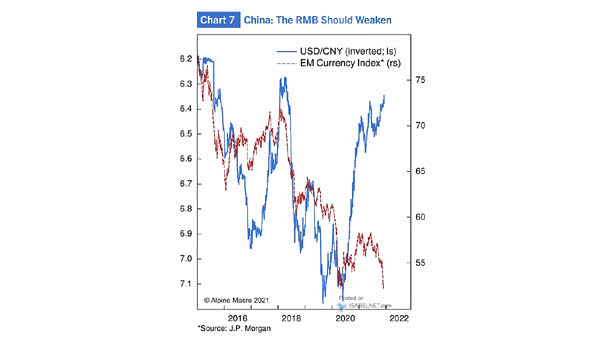
China – USD/CNY and EM Currency Index The RMB is expected to weaken relative to the U.S. dollar. Image: Alpine Macro
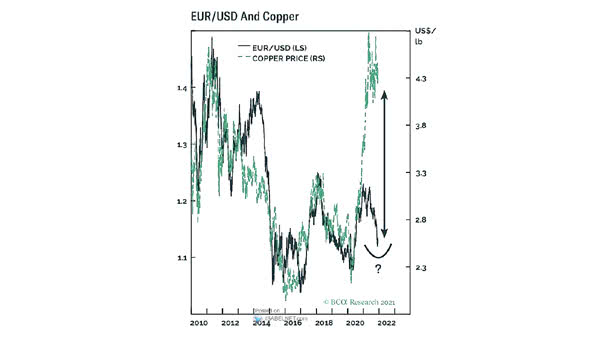
EUR/USD and Copper The gap between EUR/USD and copper is widening. Will the price of copper fall? Image: BCA Research
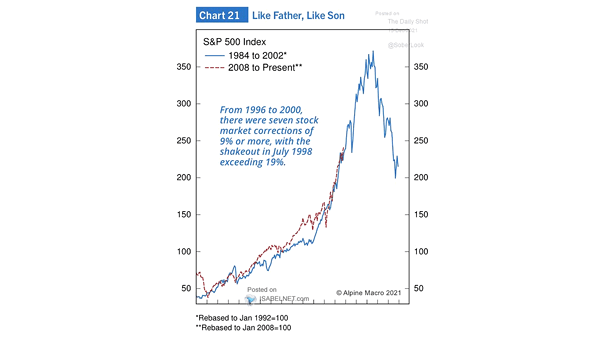
S&P 500 Index – 1984 to 2002 vs. 2008 to Present Is the S&P 500 Index on the way to the moon? Image: Alpine Macro
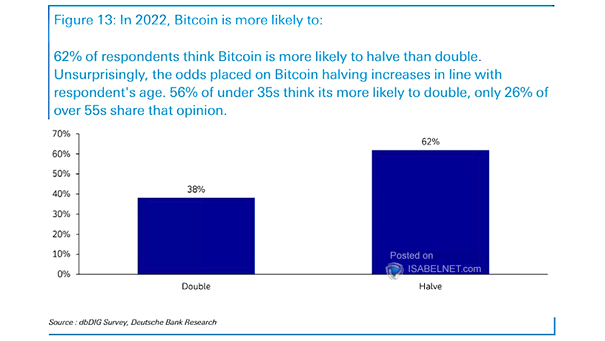
Survey – Bitcoin in 2022 Will Bitcoin halve in 2022? Image: Deutsche Bank Research