S&P 500 Growth vs. Value – Relative Total Return
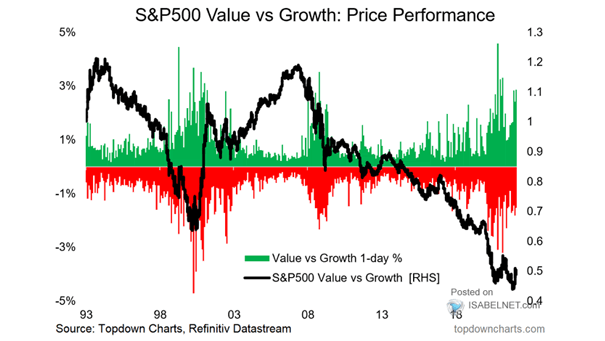
S&P 500 Growth vs. Value – Relative Total Return Value is back in favor to start the year, as lofty valuations keep investors on edge. Still, growth could stage a comeback if earnings deliver some…
S&P 500 Growth vs. Value – Relative Total Return Value is back in favor to start the year, as lofty valuations keep investors on edge. Still, growth could stage a comeback if earnings deliver some…
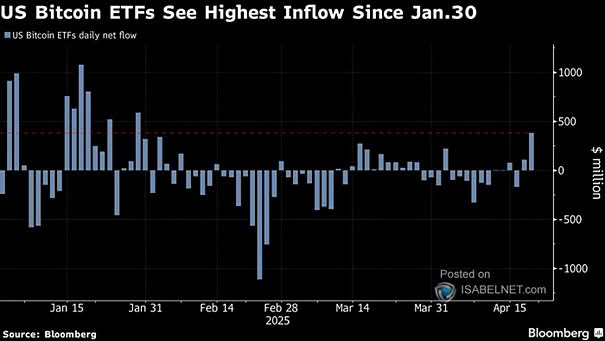
Net Monthly Flows of U.S. Spot Bitcoin ETFs Since the reversal in October 2025, institutions have cut billions in Bitcoin holdings month after month, an indication of fading appetite and a darker mood across crypto…
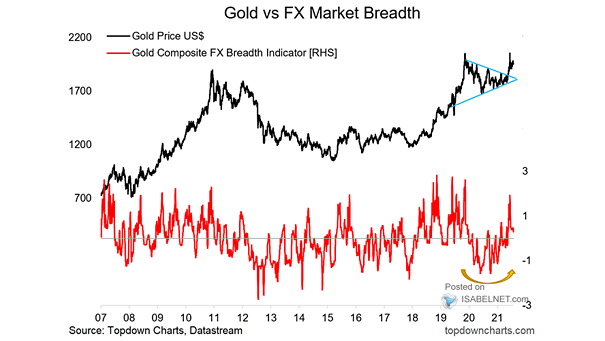
Gold Price vs. Gold Composite FX Breadth Indicator Gold’s role is shifting: it’s no longer just a safe haven but a cornerstone of monetary stability as central banks keep adding to their reserves in an…
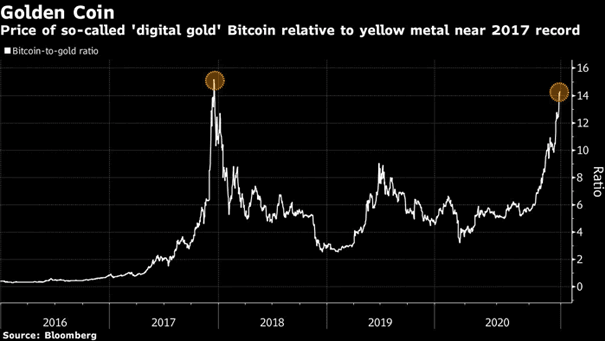
Bitcoin, Gold and S&P 500’s Performance Bitcoin has lost some ground lately, but at about 370% above its early‑2023 lows, it looks less like a speculative bet and more like a market finding its footing.…
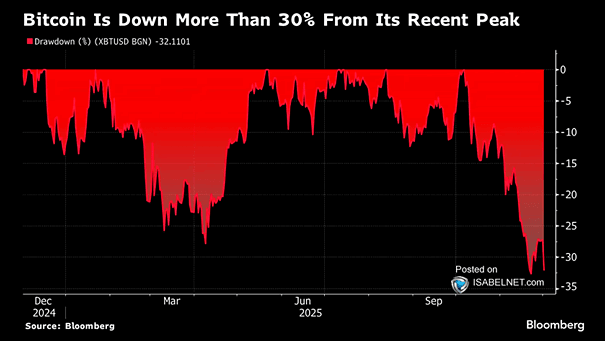
Bitcoin Drawdown Volatility persists, but Bitcoin’s drop of more than 40% from its October peak looks more like a typical correction than a structural breakdown. In most markets that would be a crash; for Bitcoin,…
Drawdowns from 52-Week Highs for Selected U.S. and Related Stocks Investors aren’t buying every U.S. tech name anymore. The market is picking clear winners and leaving the rest behind, particularly in AI-related stocks. Image: Deutsche…
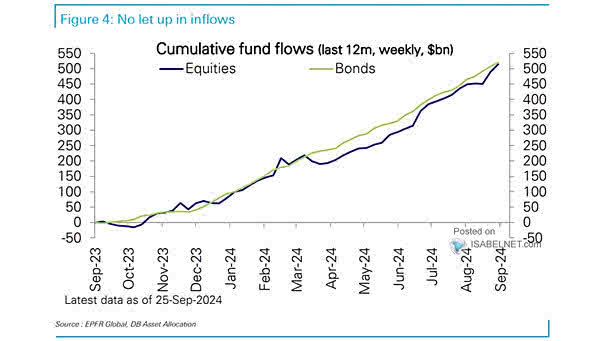
Cumulative Fund Flows Across Assets Many investors continue to favor the relative safety of bonds and money market funds over riskier equities, amid ongoing geopolitical tensions and relatively high interest rates. Image: Goldman Sachs Global…
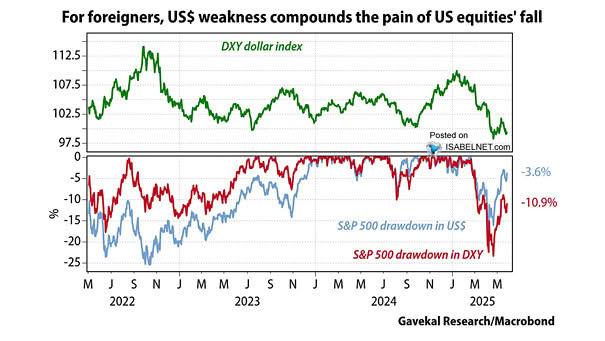
Performance – S&P 500 Relative to FTSE All-World Excluding U.S. US stocks have sunk to a two-year low versus global peers, as tariffs bite and AI gains stay concentrated among a handful of megacaps. Diversifying…
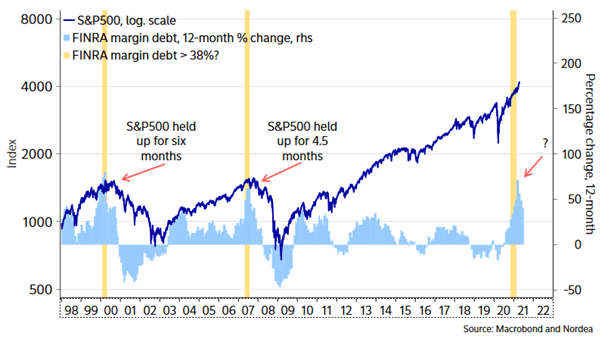
Margin Debt as Percentage of M2 (Measure of Leverage) Leverage lifts returns when markets climb but reveals the weak spots when sentiment turns. Margin debt, as a share of the money supply, now stands at…
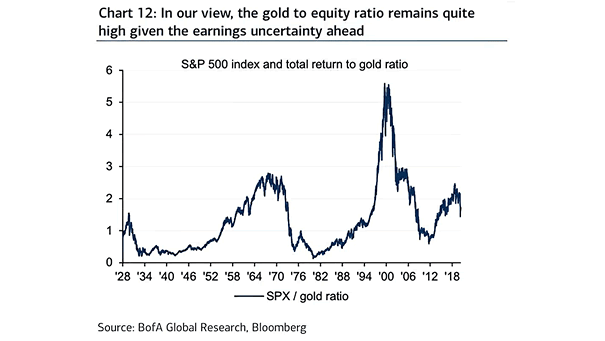
Gold to S&P 500 Ratio Gold’s outperformance has pushed the Gold-to-S&P 500 ratio to its highest since 2013, signaling a defensive shift but not yet the kind of rush to safety seen during crisis years.…
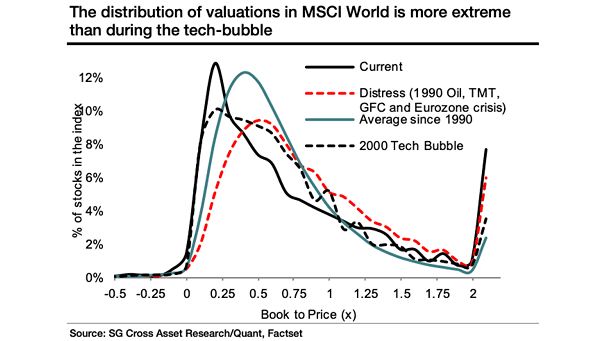
Valuation Ranges of MSCI World Styles Indices Across markets and styles, valuations remain lofty amid AI-driven optimism and market concentration, forcing investors to pick their spots carefully. Image: Goldman Sachs Global Investment Research