Stocks – STOXX Europe 600 and Equity Strategy STOXX 600 Base Case
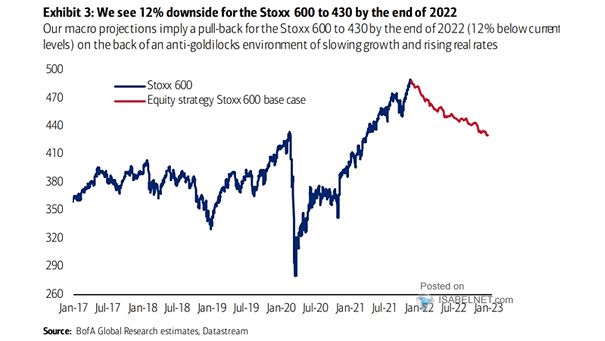
Stocks – STOXX Europe 600 and Equity Strategy STOXX 600 Base Case Should investors underweight European equities in 2022? Image: BofA Global Research
Stocks – STOXX Europe 600 and Equity Strategy STOXX 600 Base Case Should investors underweight European equities in 2022? Image: BofA Global Research
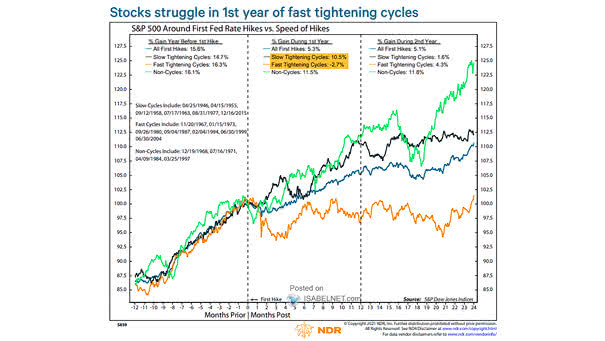
S&P 500 Around First Fed Rate Hikes vs. Speed of Hikes Historically, the S&P 500 has tended to struggle in the first year of fast tightening cycles. Image: Ned Davis Research
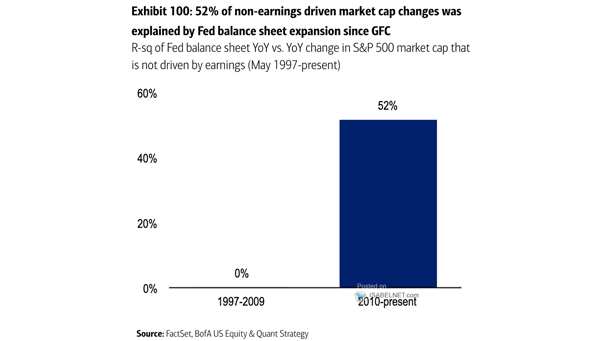
Returns – R-squared of Fed Balance Sheet YoY vs. YoY Change in S&P 500 Market Capitalization that is not Driven by Earnings Since 2010, the Fed balance sheet expansion tends to explain 52% of S&P…
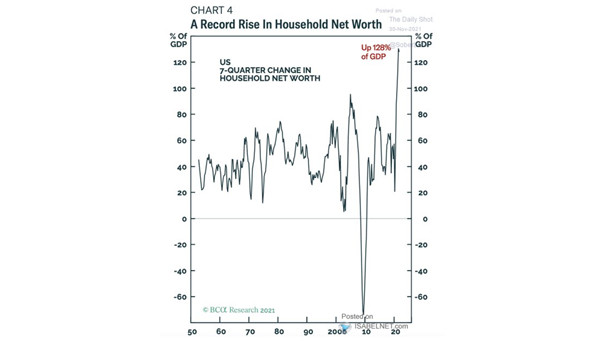
7-Quarter Change in U.S. Household Net Worth The net worth of U.S. households reached a record high of 128% of GDP. Image: BCA Research
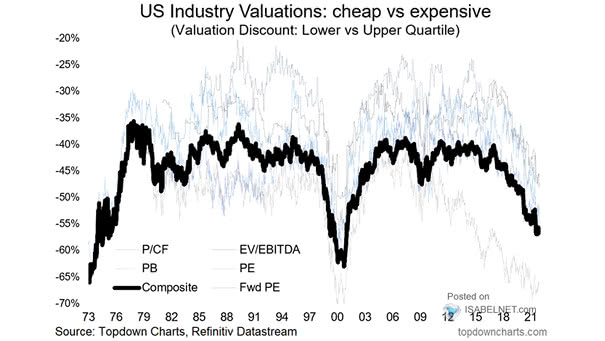
U.S. Industry Valuations – Cheap vs. Expensive The valuation differential between the cheapest vs. most expensive industries in the U.S. is at the lowest level in 20 years. Image: Topdown Charts
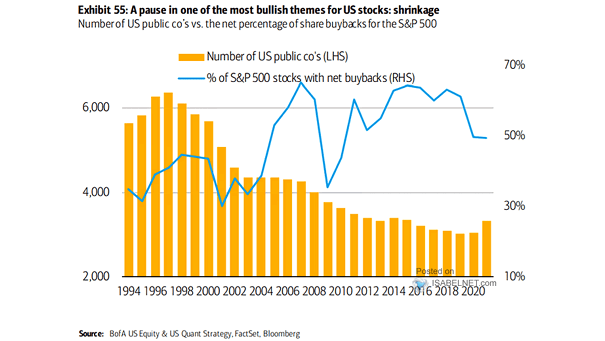
Number of U.S. Public Companies vs. the Net Percentage of Share Buyback for the S&P 500 The number of U.S. publicly traded companies is on the rise, thanks to a strong bull market. Image: BofA…
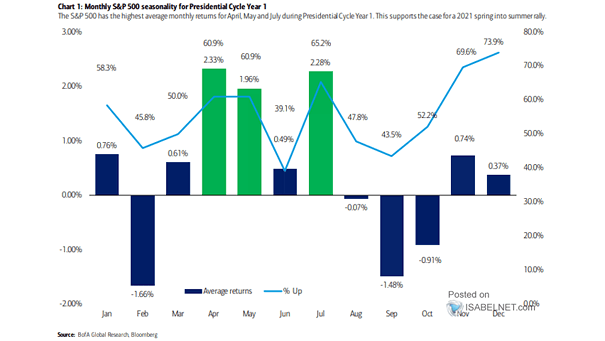
Monthly S&P 500 Seasonality for Presidential Cycle Year 1 S&P 500 seasonality shows that December is historically a positive month in Presidential cycle year 1. Image: BofA Global Research
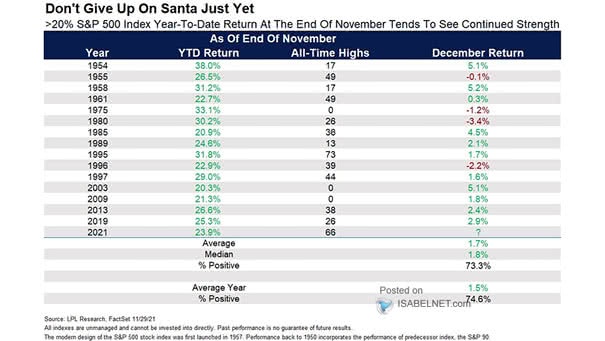
S&P 500 – >20% YTD Return at the End of November When the S&P 500 is up more than 20% at the end of November, December tends to be bullish for U.S. stocks.
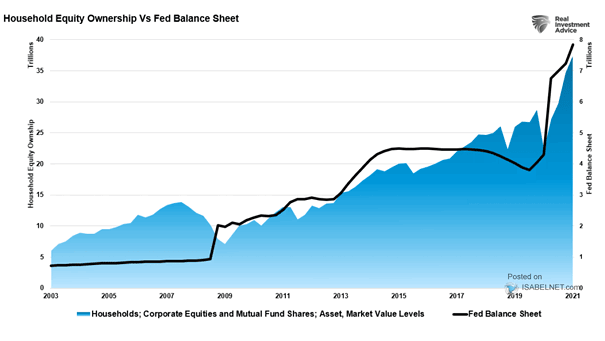
Household Equity Ownership vs. Fed Balance Sheet The expansion of the Fed’s balance sheet tends to increase household equity ownership. Image: Real Investment Advice
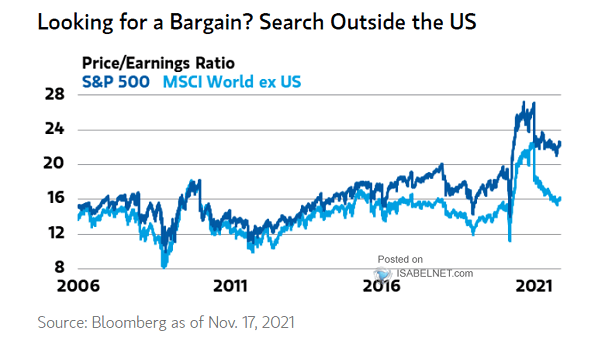
Valuation – Price/Earnings Ratio, S&P 500 vs. MSCI World Ex-U.S. Should equity investors consider overseas stocks? Image: Morgan Stanley Wealth Management
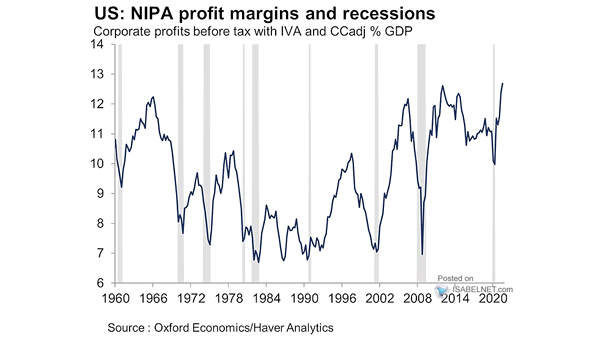
U.S. NIPA Profit Margins and Recessions U.S. corporate profits are booming. Image: Oxford Economics