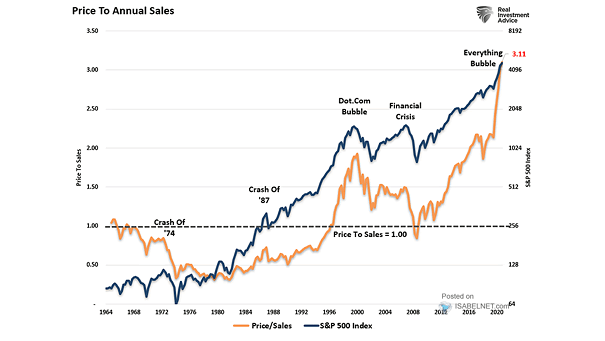
Valuation – S&P 500 Index and Price to Annual Sales
Valuation – S&P 500 Index and Price to Annual Sales Measured by price to annual sales, U.S. stocks are looking more and more expensive. Should investors take a cautious approach to U.S. equities in 2022?…