Spread Between Equity and Government Bond 10-Year Rolling Returns
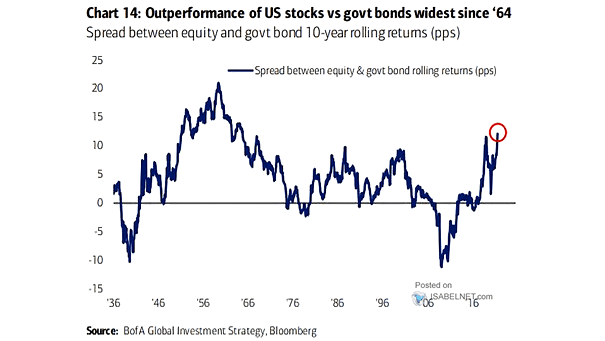
Spread Between Equity and Government Bond 10-Year Rolling Returns Will U.S. stocks continue to outperform government bonds? Image: BofA Global Investment Strategy
Spread Between Equity and Government Bond 10-Year Rolling Returns Will U.S. stocks continue to outperform government bonds? Image: BofA Global Investment Strategy
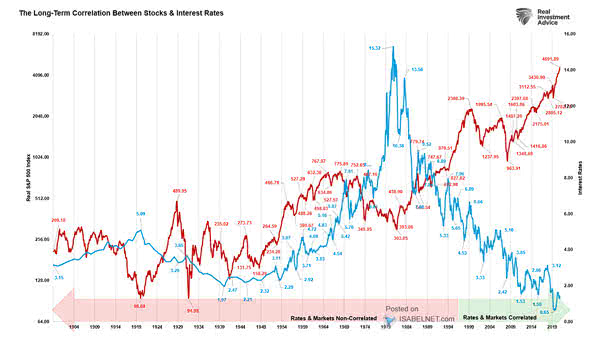
The Long-Term Correlation Between U.S. Stocks and U.S. Interest Rates Rising interest rates tend to have a negative effect on earnings and the stock market. Image: Real Investment Advice
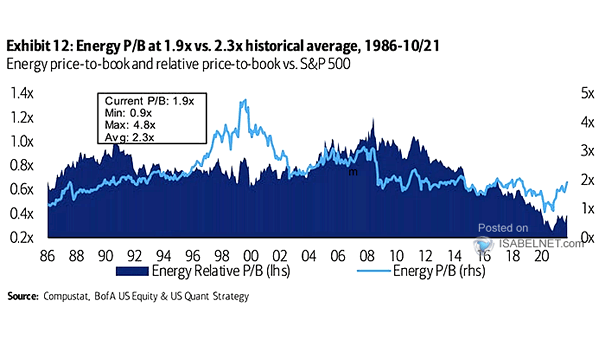
Valuation – Energy Price-to-Book and Relative Price-to-Book vs. S&P 500 Measured by the price-to-book ratio, the energy sector looks relatively cheap. Should investors expect energy stocks to rise in 2022? Image: BofA US Equity &…
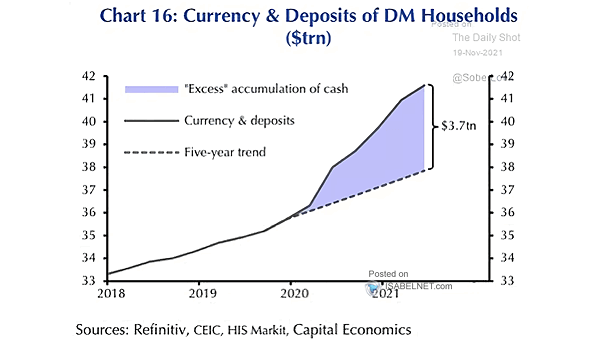
Cash – Currency and Deposits of DM Households Could the excess accumulation of cash drive global stock markets higher? Image: Capital Economics
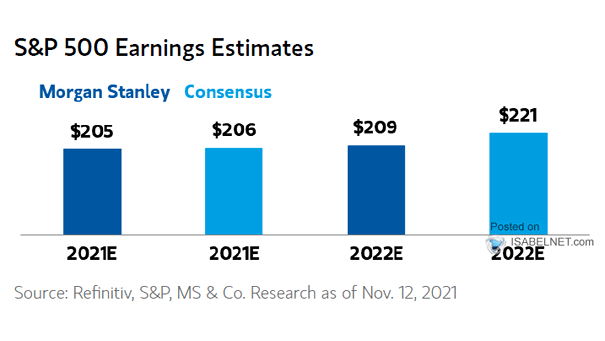
S&P 500 Earnings Estimates Through 2022 Morgan Stanley still expects S&P 500 earnings to rebound to $205 in 2021 and $209 in 2022. Image: Morgan Stanley Research
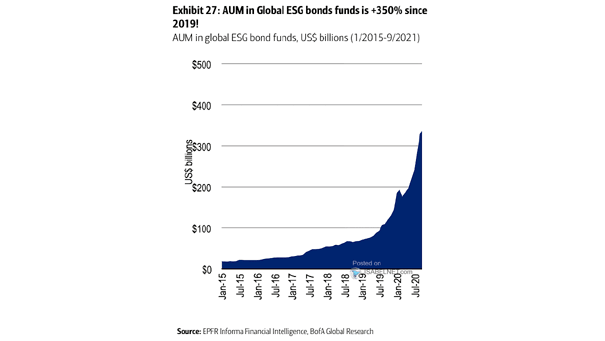
AUM in Global ESG Bond Funds AUM in global ESG bond funds shows no signs of slowing down. Image: BofA Global Research
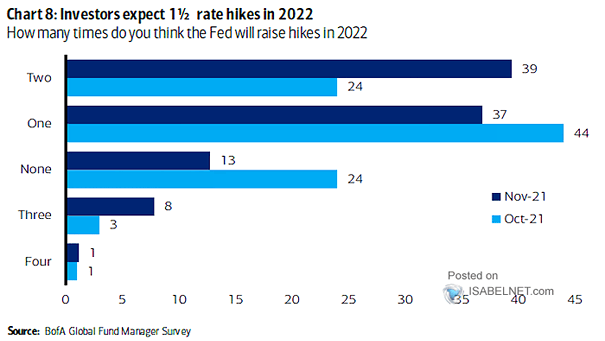
How Many Times Do You Think The Fed Will Raise Rates? FMS investors expect 1.5 Fed rate hikes in 2022 and do not expect the Fed to tighten aggressively. Image: BofA Global Fund Manager Survey
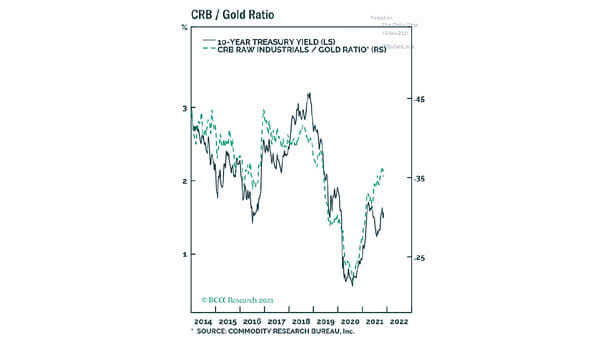
CRB Raw Industrials to Gold Ratio Does the CRB raw industrials index to gold ratio suggest higher 10-year UST yields? Image: BCA Research
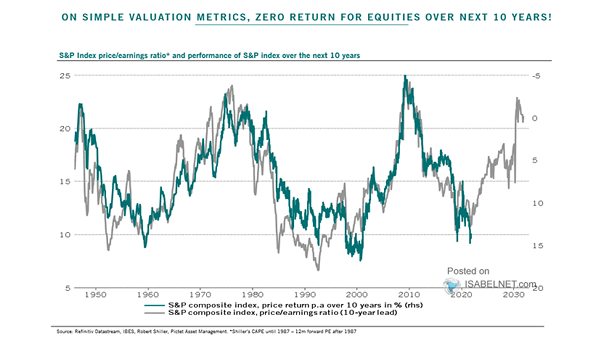
Return – S&P 500 Index Price/Earnings Ratio and Performance of S&P 500 Index over the Next 10 Years Should investors expect zero return over the next 10 years? Image: Pictet Asset Management
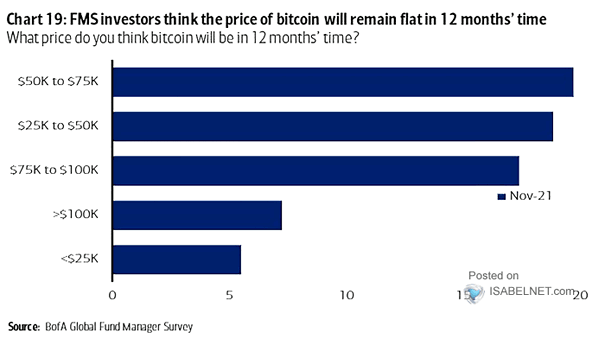
What Price Do You Think Bitcoin Will Be In 12 Months’ Time? Will Bitcoin remain between $50K to $75 in the next 12 months? Image: BofA Global Fund Manager Survey
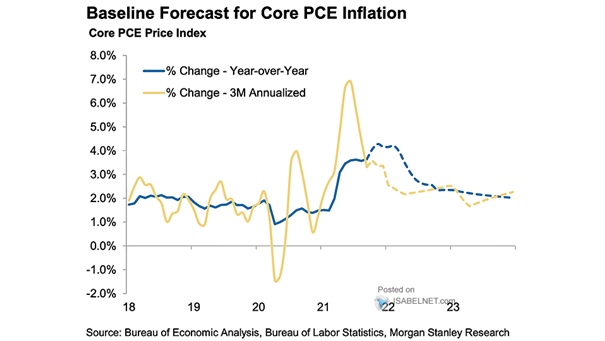
Baseline Forecast for U.S. Core PCE Inflation U.S. core PCE inflation is expected to remain above 3% through June 2022. Image: Morgan Stanley Research