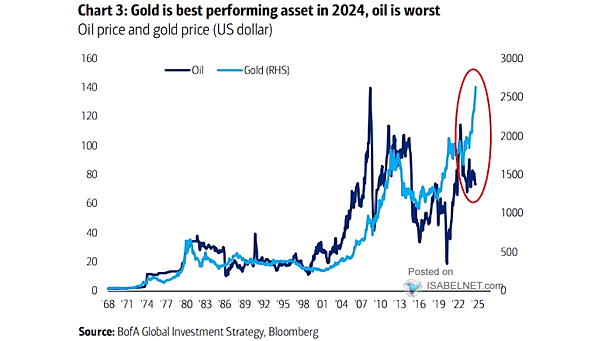
Gold vs. Oil vs. Fed Pricing
Gold vs. Oil vs. Fed Pricing After moving opposite to oil in March and April, gold diverged in May and is now trading more in line with Fed rate expectations. Image: Deutsche Bank Research
Gold vs. Oil vs. Fed Pricing After moving opposite to oil in March and April, gold diverged in May and is now trading more in line with Fed rate expectations. Image: Deutsche Bank Research
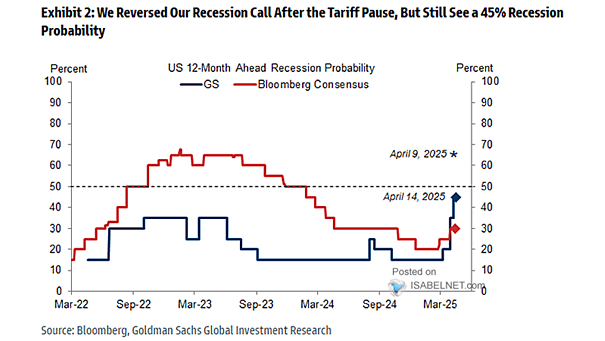
Estimated U.S. Recession Probability The U.S.-Iran agreement has taken some tail risk off the table, with Goldman Sachs trimming its 12-month U.S. recession call to 15% from 25%, back at its long-term average. Image: Goldman…
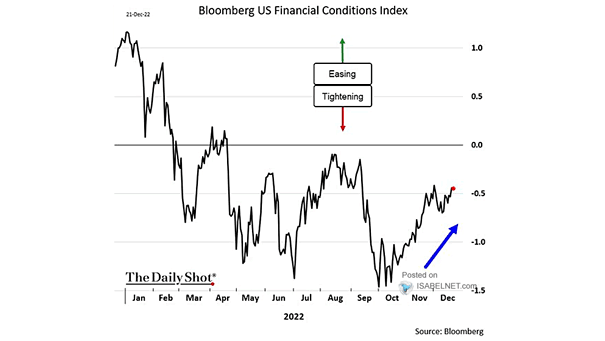
U.S. Financial Conditions Index U.S. financial conditions have eased since March, pointing to a more growth‑friendly backdrop. Looser conditions typically give near‑term GDP a lift. Image: Deutsche Bank Research
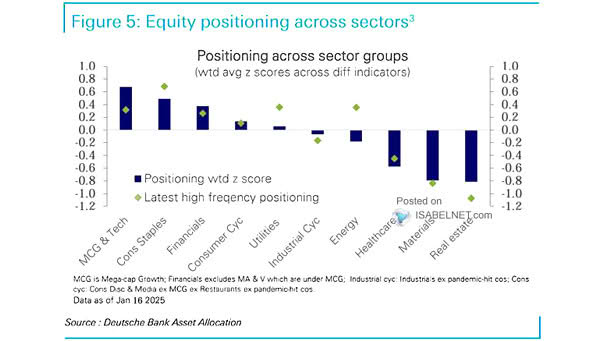
Sectors Positioning (High Frequency) Positioning in mega-cap growth and tech sits near neutral, while cyclicals remain deeply underweight at the 8th percentile. It would not take much positive news to trigger a sharp reversal. Image:…
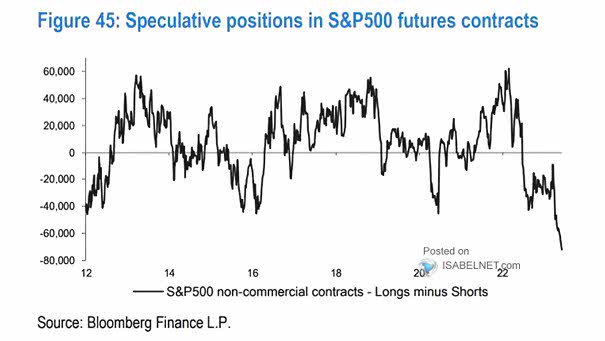
S&P 500 and Speculators’ Net Positioning Speculators have turned increasingly bearish on U.S. equities. When net short positioning reaches these kinds of extremes, it has often set the stage for sharp short squeezes, a classic…
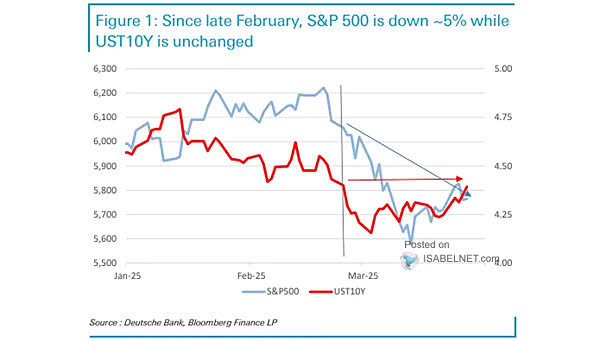
S&P 500 vs. U.S. 10-Year Bond Correlation Since the COVID-19 pandemic, equities and bonds have increasingly moved in tandem, especially during inflation spikes and rate hikes, weakening bonds’ traditional role as a diversifier. Image: Goldman…
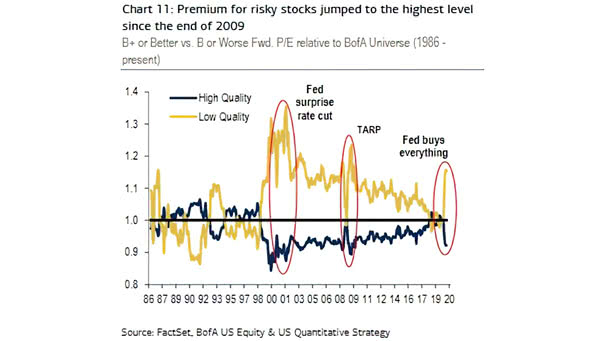
U.S. Quality vs. Momentum Equities Since the March lows, momentum has taken the lead over quality, backed by strong earnings prints and positive price action. For now, investors are sticking with companies that deliver on…
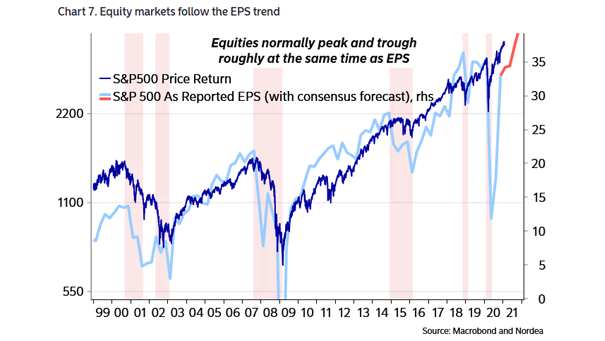
Price Return in 2026 The median stock in each region is lagging this year, with gains concentrated in a narrow group of heavyweight tech names. Image: Goldman Sachs Global Investment Research
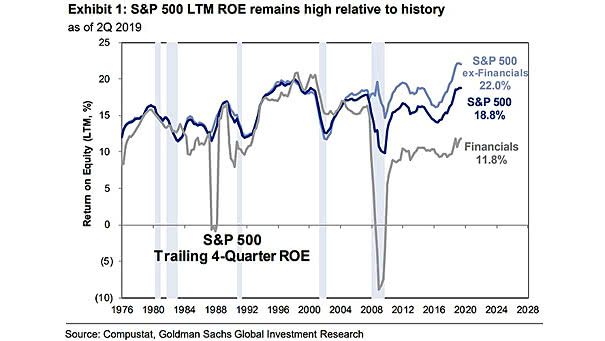
ROE for Mega-Cap Tech and the Rest of the S&P 500 Mega-cap tech’s return on equity is expected to face headwinds and decline through 2028, while the rest of the S&P 500 sees ROE trending…
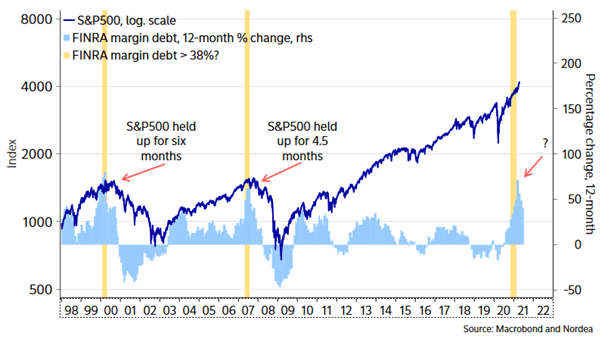
Margin Debt as Percentage of M2 (Measure of Leverage) Leverage amplifies gains in rising markets but reveals fragility when sentiment turns. Margin debt relative to the money supply is running hot, echoing levels last seen…
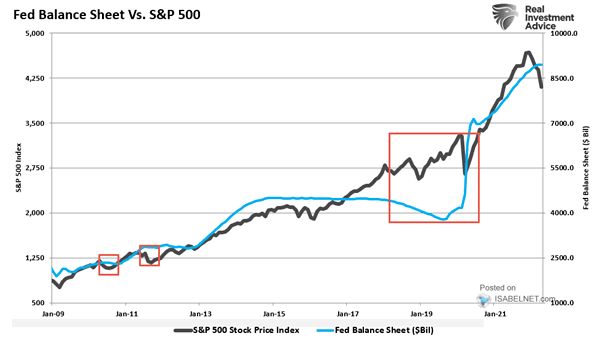
S&P 500 Performance Under New Fed Leadership Since 1930 New Fed leadership rarely drives the market narrative. It tends to follow the momentum already in place across the economy. Transitions, however, can change the intensity…