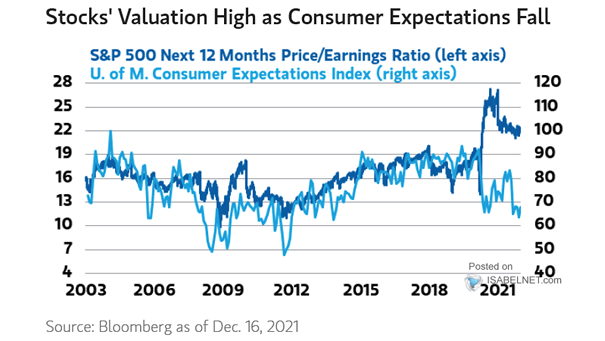
WTI Crude Oil Price Seasonality
WTI Crude Oil Price Seasonality Seasonality suggests that oil prices tend to move lower into year end. Image: Topdown Charts
National Income vs. GDP and U.S. Recessions Fast rising compensation of employees tends to precede economic slowdowns in the United States. The U.S. economic recovery is expected to slow down in 2022. Image: Real Investment…
S&P 500 Real Earnings Yield Historically, negative real earnings yields tend to be bearish for U.S. stocks due to policy response. Image: BofA Global Investment Strategy
Estimated Net Retail Flow vs. S&P 500 Return Will retail investors keep buying the dip? Image: Morgan Stanley Quantitative and Derivative Strategies
Central Bank Asset Purchases The pace of global central bank purchases is expected to turn negative next year. Image: BofA Global Investment Strategy
S&P 500 vs. Fed Fund Rates and Real GDP Equity markets are vulnerable to tapering and rising rates. Could the Fed be making a policy mistake? Image: Real Investment Advice
Oil Prices and Consensus Capex Could oil capex cuts lead to supply disruptions? Image: Morgan Stanley Research
5-Year Rolling Correlation Between S&P 500 TTM EPS YoY vs. China Nominal GDP and U.S. Nominal GDP China’s economic growth slowdown suggests trouble ahead for the S&P 500. Image: BofA US Equity & Quant Strategy
U.S. ISM Manufacturing vs. Philadelphia Fed Leading-Lagging Parts – Leading Indicator Philadelphia Fed leading vs. lagging variables tend to lead U.S. ISM Manufacturing by 10 months. Image: Nordea and Macrobond
Major Central Bank Assets vs. S&P 500 Index The expansion of central bank balance sheets tends to push the S&P 500 Index higher. Is the sky the limit? Image: Lohman Econometrics
Inflation – CAPE Valuation vs. CPI Historically, valuations for the S&P 500 have been highest when CPI is between 1% to 4%. Image: Real Investment Advice