Treasuries Total Return Index
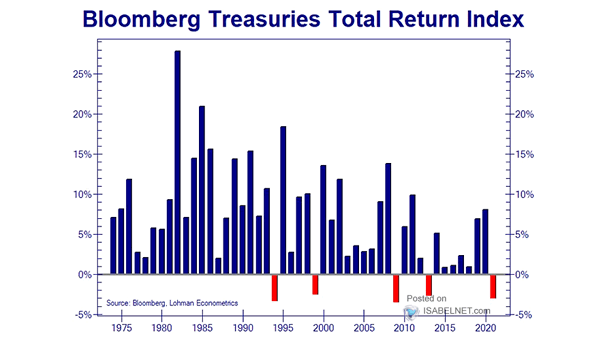
Treasuries Total Return Index Should investors expect total returns on U.S. Treasuries to be positive next year? Image: Lohman Econometrics
Treasuries Total Return Index Should investors expect total returns on U.S. Treasuries to be positive next year? Image: Lohman Econometrics
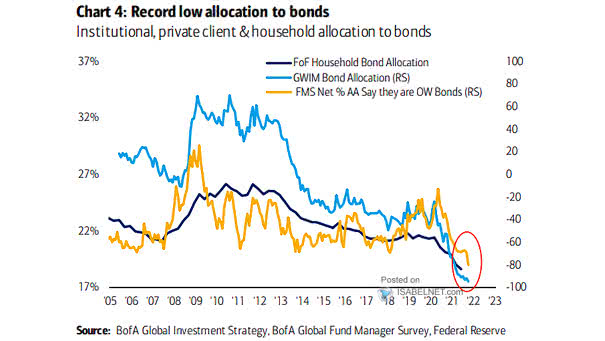
Institutional, Private Client and Household Allocation to Bonds Are investors too pessimistic about the outlook for bonds? Image: BofA Global Investment Strategy
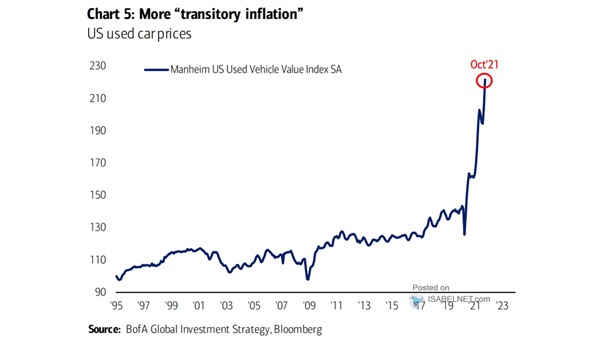
Inflation – U.S. Used Car Prices When will the surge in U.S. used car prices end? Image: BofA Global Investment Strategy
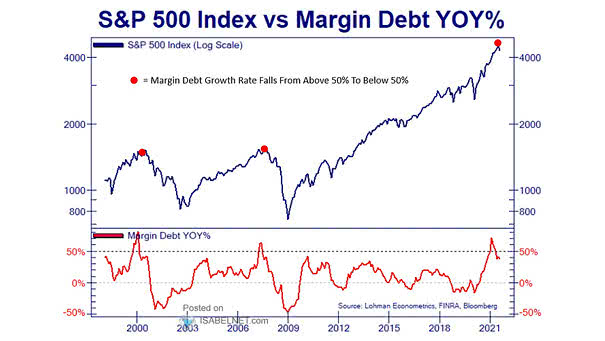
S&P 500 Index vs. Margin Debt Should investors be worried that the margin debt growth rate falls below 50%? Image: Lohman Econometrics
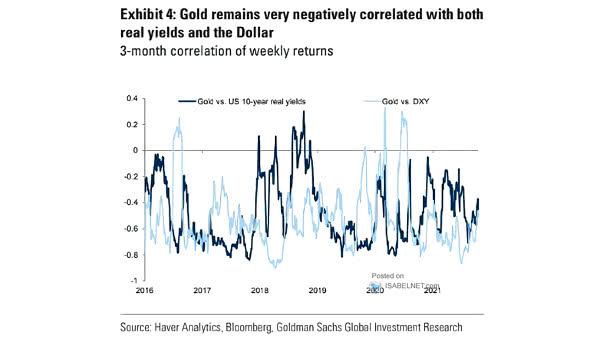
Gold vs. U.S. 10-Year Real Yields and U.S. Dollar Index – 3-Month Correlation of Weekly Return Generally, U.S. 10-year real yields and the U.S. dollar are negatively correlated with the price of gold. Image: Goldman…
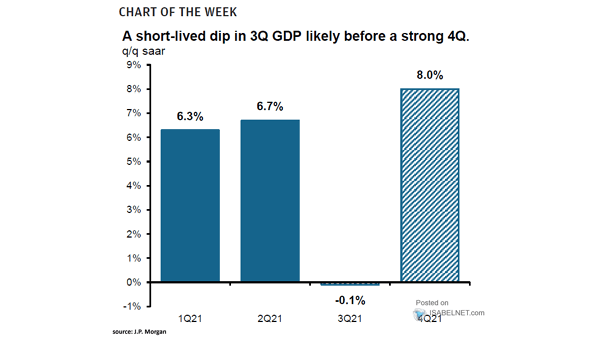
U.S. GDP The slowdown in U.S. GDP is expected to be short-lived. Image: J.P. Morgan Asset Management
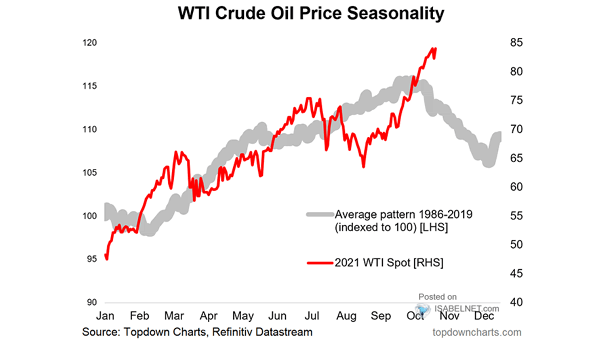
WTI Crude Oil Price Seasonality Seasonality suggests that oil prices tend to move lower into year end. Image: Topdown Charts
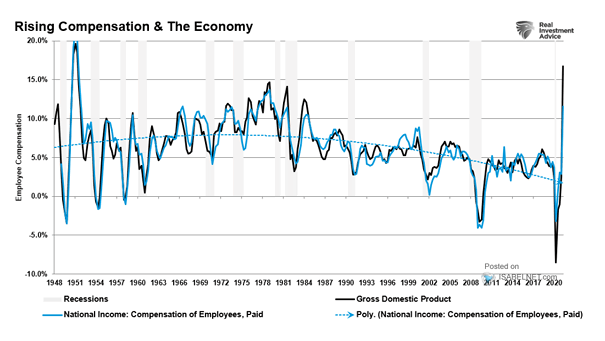
National Income vs. GDP and U.S. Recessions Fast rising compensation of employees tends to precede economic slowdowns in the United States. The U.S. economic recovery is expected to slow down in 2022. Image: Real Investment…
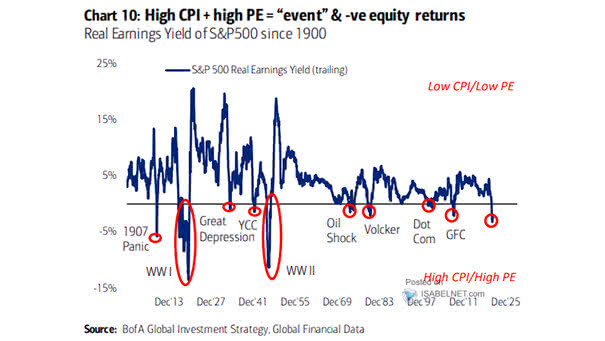
S&P 500 Real Earnings Yield Historically, negative real earnings yields tend to be bearish for U.S. stocks due to policy response. Image: BofA Global Investment Strategy
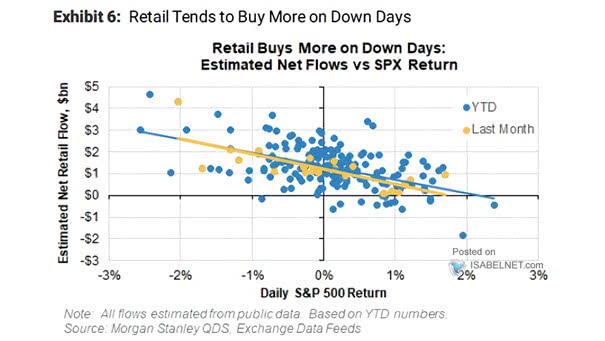
Estimated Net Retail Flow vs. S&P 500 Return Will retail investors keep buying the dip? Image: Morgan Stanley Quantitative and Derivative Strategies
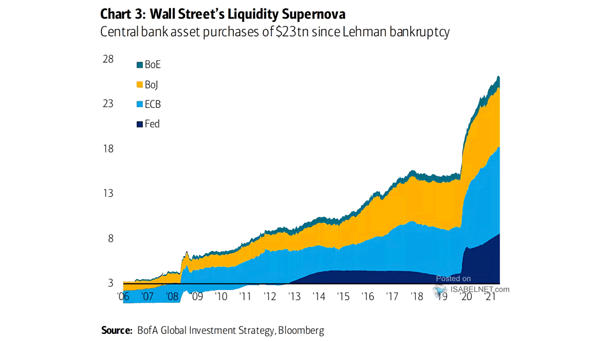
Central Bank Asset Purchases The pace of global central bank purchases is expected to turn negative next year. Image: BofA Global Investment Strategy