New S&P 500 Index All-Time Highs Through September
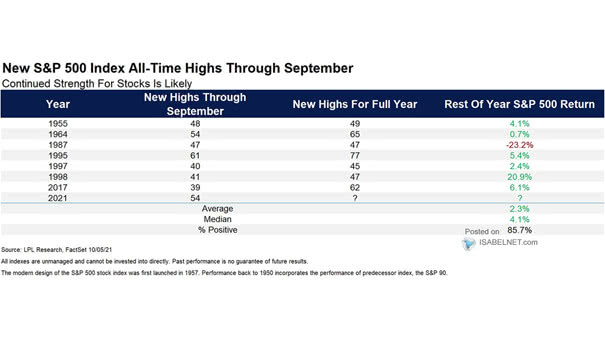
New S&P 500 Index All-Time Highs Through September Historically, a lot of new all-time highs in September tend to be bullish for Q4. Image: LPL Research
New S&P 500 Index All-Time Highs Through September Historically, a lot of new all-time highs in September tend to be bullish for Q4. Image: LPL Research
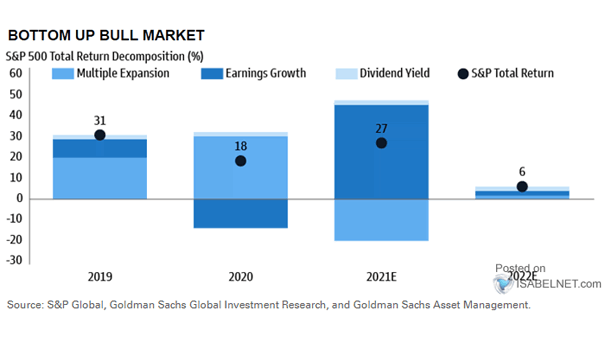
S&P 500 Total Return Decomposition Goldman Sachs expects S&P 500 returns to be moderate in 2022 and beyond, driven primarily by earnings growth. Image: Goldman Sachs Global Investment Research
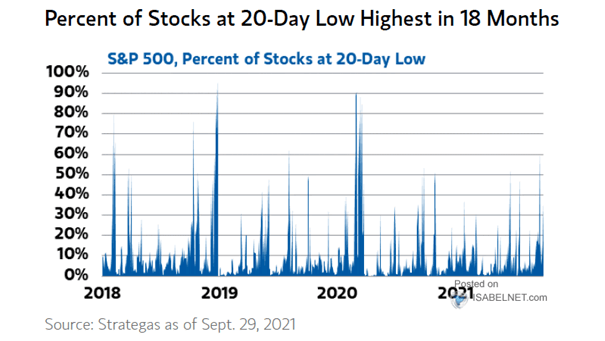
S&P 500 and Percent of Stocks at 20-Day Low The number of S&P 500 stocks trading at 20-day lows has increased. Image: Morgan Stanley Wealth Management
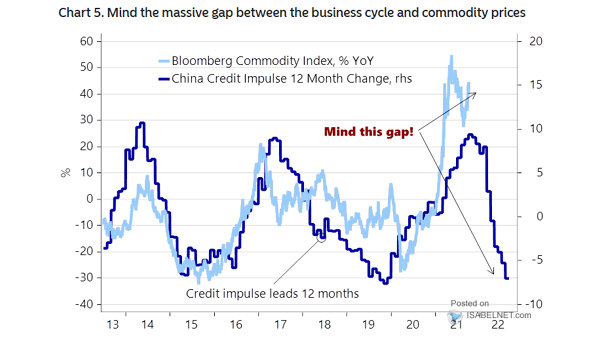
China Credit Impulse and Commodities (Leading Indicator) China credit impulse tends to lead commodity prices by 12 months. Image: Nordea and Macrobond
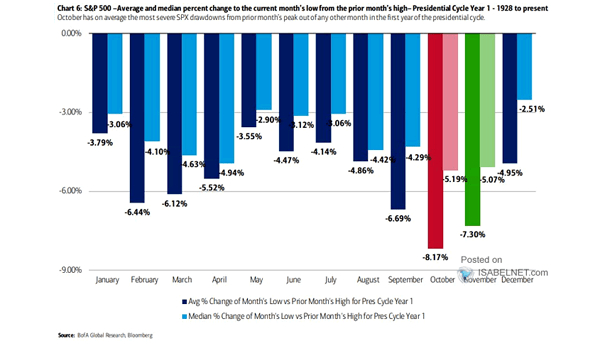
Drawdowns – Average and Median Percent Change to the Current Month’s Low from the Prior Month’s High in Presidential Cycle Year 1 Drawdowns happen all the time. But historically, October has the most severe S&P…
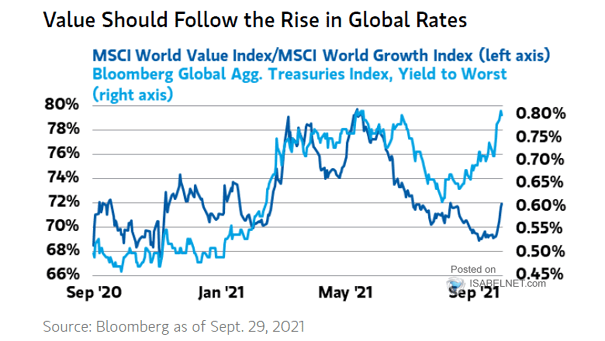
MSCI World Value Index/MSCI World Growth Index vs. Global Agg. Treasuries Index, Yield to Worst Value should outperform Growth and follow the rise in global rates. Image: Morgan Stanley Wealth Management
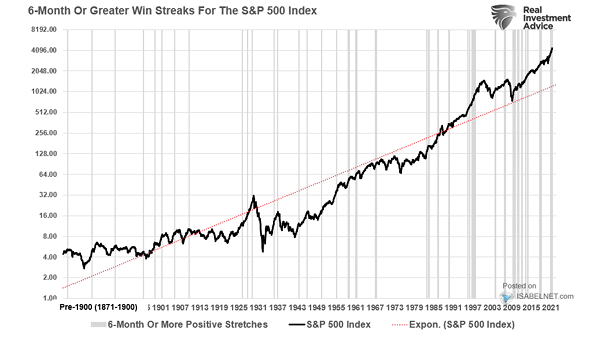
6-Month or Greater Win Streaks for the S&P 500 Index 6-month win streaks for the U.S. stock market are quite rare. Can the S&P 500 keep rising after the near 5% correction last month? Image:…
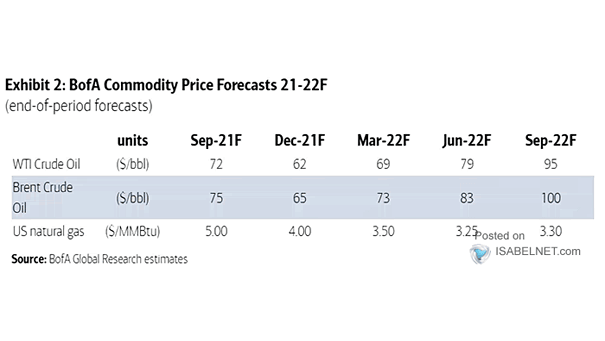
Oil and Gas – Commodity Price Forecasts BofA expects Brent crude oil prices to reach $100/bbl in September 2022. Image: BofA Global Research
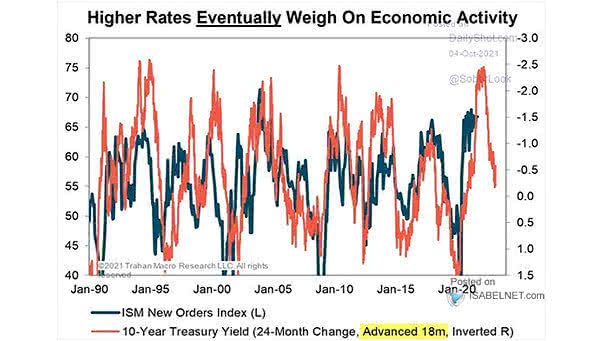
ISM New Orders Index and U.S. 10-Year Treasury Yield (Leading Indicator) The U.S. 10-year Treasury yield (24-month change) tends lead ISM new orders by 18 months. Image: Trahan Macro Research
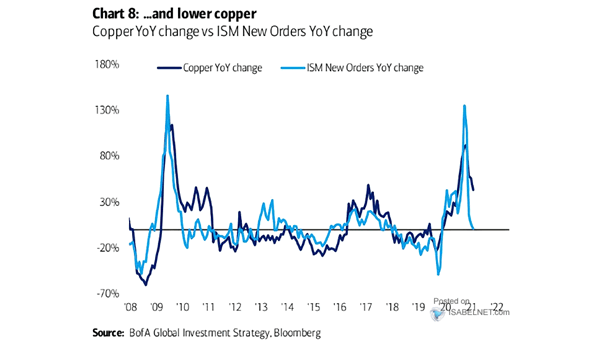
Copper YoY Change vs. ISM New Orders YoY Change ISM new orders trends point to a decline in copper prices. Image: BofA Global Investment Strategy
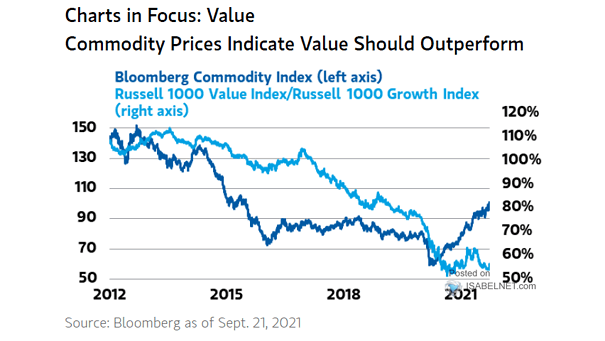
Commodity Index vs. Russell 1000 Value Index/Russell Growth Index Value should outperform Growth as commodity prices are rising rapidly. Image: Morgan Stanley Wealth Management