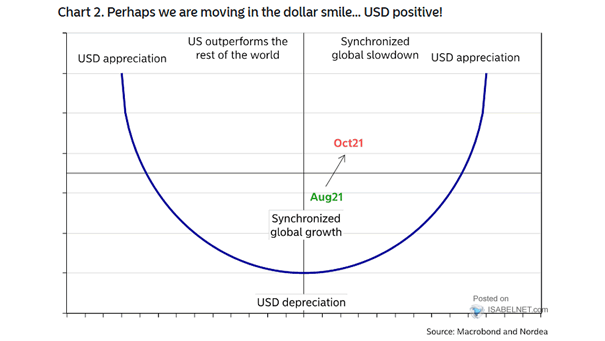
U.S. Dollar Smile: Dollar Appreciation and Depreciation
U.S. Dollar Smile: Dollar Appreciation and Depreciation A global synchronized slowdown tends to coincide with a stronger U.S. dollar. Image: Nordea and Macrobond
U.S. Dollar Smile: Dollar Appreciation and Depreciation A global synchronized slowdown tends to coincide with a stronger U.S. dollar. Image: Nordea and Macrobond
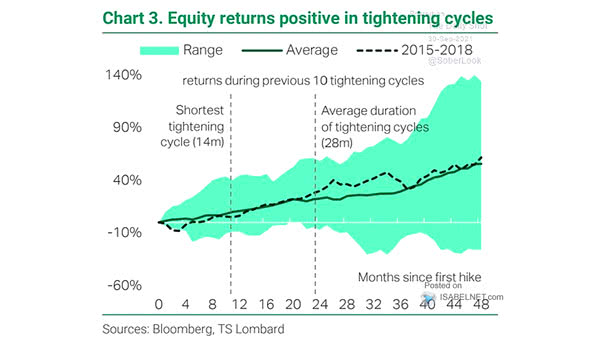
Equity Returns During Previous 10 Tightening Cycles Will the U.S. stock market keep investors smiling? Equity returns tend to be positive during tightening cycles. Image: TS Lombard
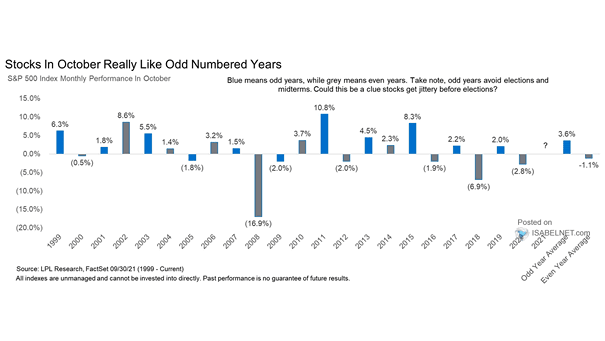
S&P 500 Index Monthly Performance in October In October, U.S. stocks tend to perform better in odd years than in even years, as odd years avoid elections and midterms. Image: LPL Research
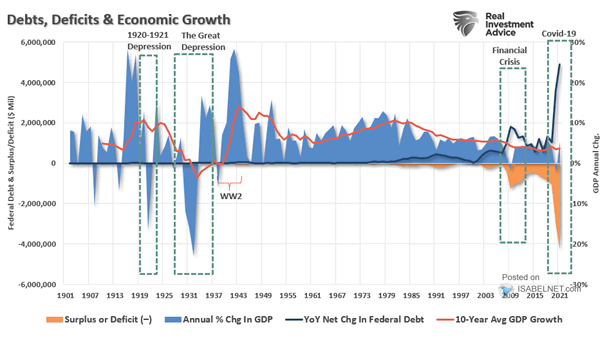
U.S. Debts, Deficits and Economic Growth The rise in the U.S. deficit and debt has coincided with declining economic growth rates. Image: Real Investment Advice
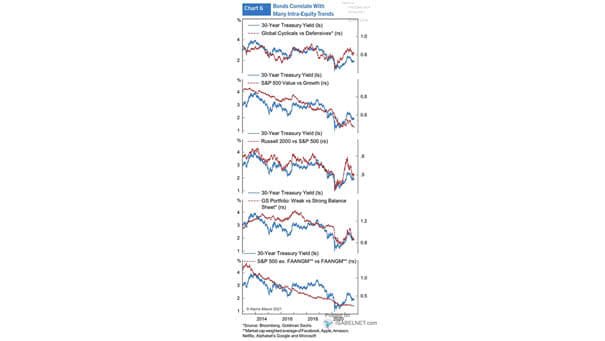
Bonds and Correlations – 30-Year Treasury Yield The U.S. 30-year Treasury yield correlates with many intra-equity trends. Image: Alpine Macro
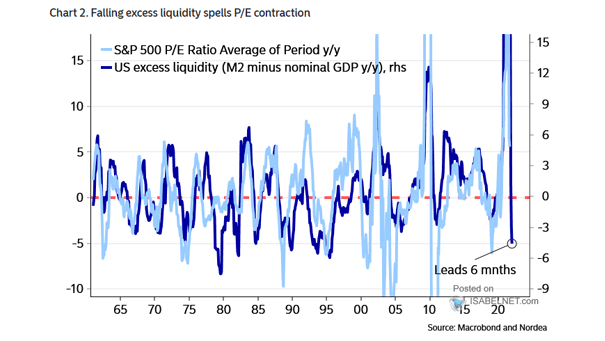
U.S. Excess Liquidity (M2 Minus Nominal GDP) and S&P 500 P/E Ratio (Leading Indicator) U.S. excess liquidity (M2 minus nominal GDP) tends to lead the S&P 500 P/E ratio by 6 months. Image: Nordea and…
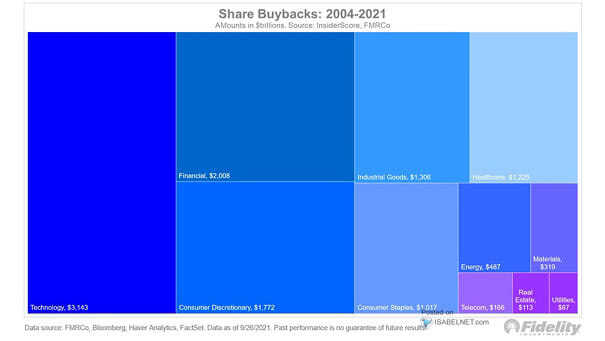
Cumulative Share Buybacks by Sector U.S. companies have spent $11 trillion on share repurchases since 2004, which has helped drive the U.S. stock market to record levels. Image: Fidelity Investments
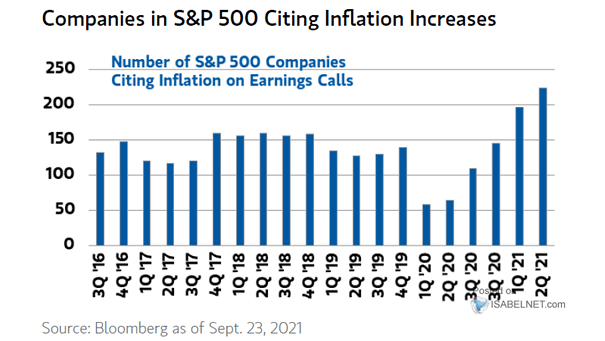
Number of S&P 500 Companies Citing Inflation on Earnings Calls S&P 500 company mentions of “inflation” jump to record levels. Image: Morgan Stanley Wealth Management
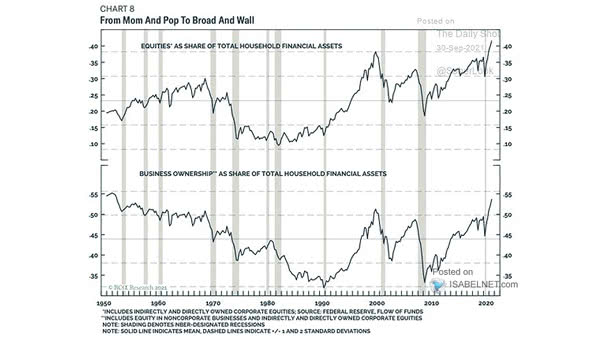
Equities as Share of Total Household Financial Assets U.S. households are loaded with equities. Will this end well? Image: BCA Research
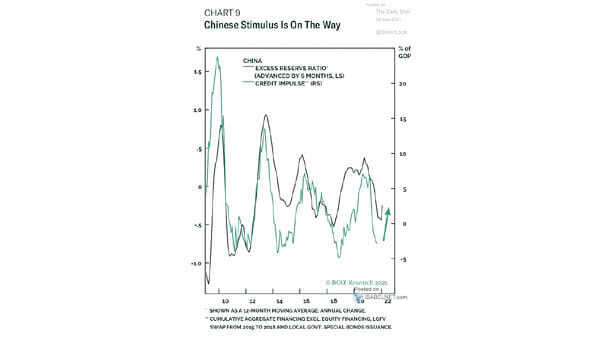
China Excess Reserve Ratio and Credit Impulse (Leading Indicator) Investors should be pleased as Chinese stimulus is on the way. Image: BCA Research
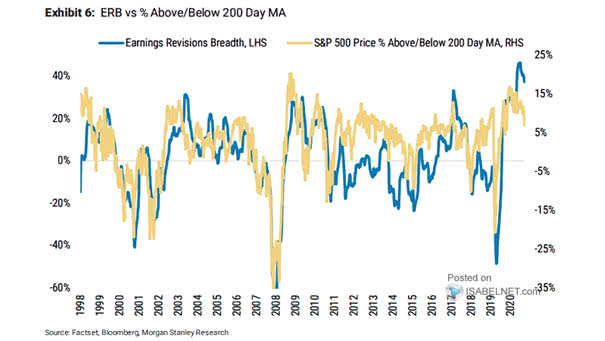
Earnings Revisions Breadth and S&P 500 Price % Above/Below 200-Day Moving Average Earnings revisions have likely peaked. Image: Morgan Stanley Research