European vs. Global Equities Projections
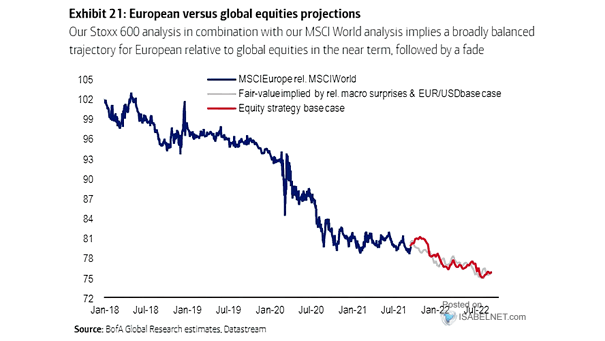
European vs. Global Equities Projections European equities are expected to underperform global equities over the next 12 months. Image: BofA Global Research
European vs. Global Equities Projections European equities are expected to underperform global equities over the next 12 months. Image: BofA Global Research
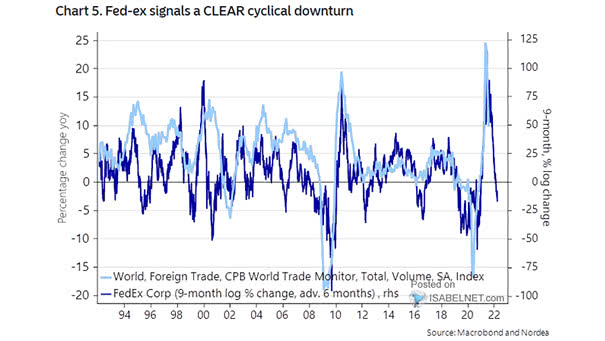
FedEx vs. World Trade (Leading Indicator) Fedex tends to lead world trade by 6 months. Image: Nordea and Macrobond
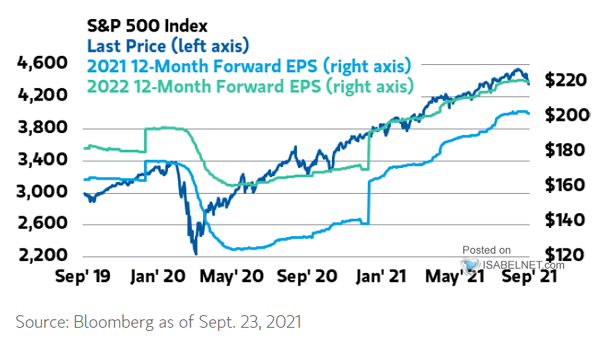
Earnings Expectations – S&P 500 Index and 12-Month Forward EPS Are earnings expectations too optimistic? Image: Morgan Stanley Wealth Management
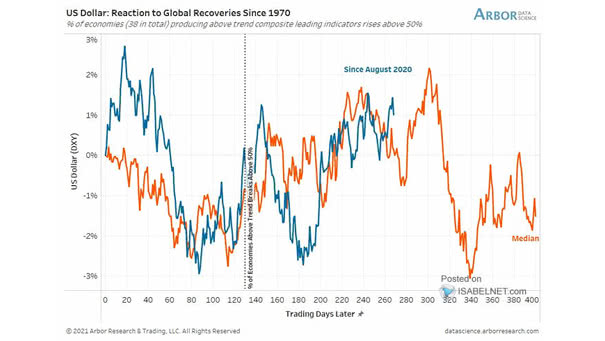
U.S. Dollar – Reaction to Global Recoveries So far, the U.S. dollar continues to follow the historical pattern after global recoveries. Image: Arbor Research & Trading LLC
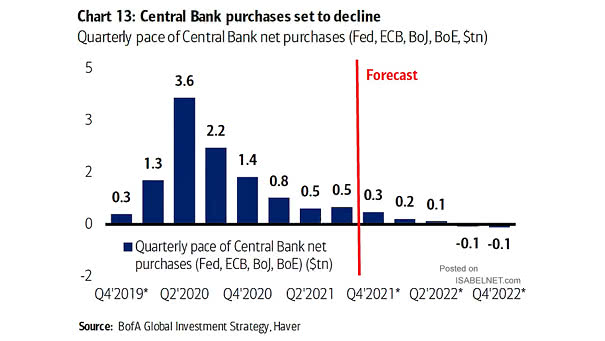
Central Banks – Quarterly Pace of Fed, ECB, BoJ, BOE Net Purchases (Quantitative Easing – QE) The pace of global central bank purchases is expected to turn negative in Q1 2022. Image: BofA Global Research
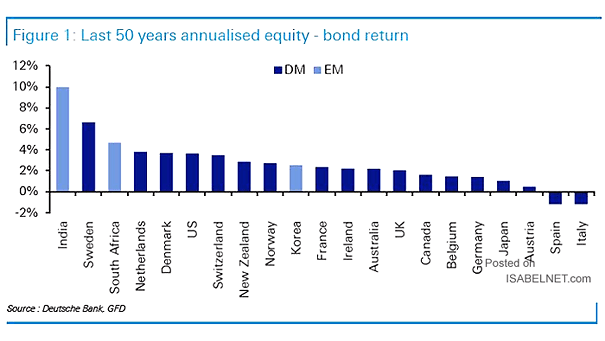
Last 50 Years Annualized Equity Minus Bond Return Should long-term investors buy equities over bonds? Image: Deutsche Bank Research
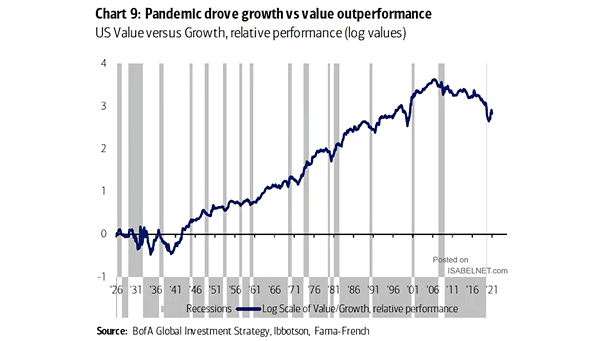
Relative Performance – U.S. Value vs. Growth In a lower growth world, are growth stocks going to permanently outperform value stocks? Image: BofA Global Investment Strategy
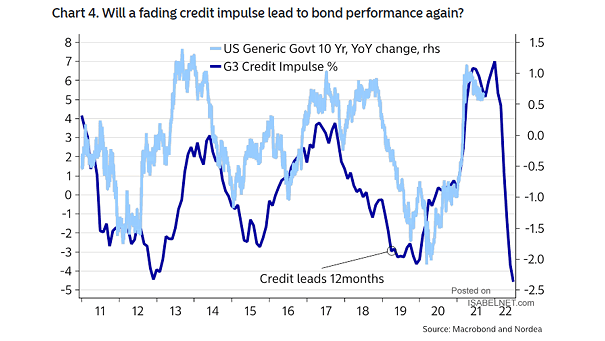
China Credit Impulse and U.S. Generic Government 10-Year Yield (Leading Indicator) China’s credit impulse tends to lead the U.S. 10-year bond yield by 12 months. Is it time to buy long-dated bonds? Image: Nordea and…
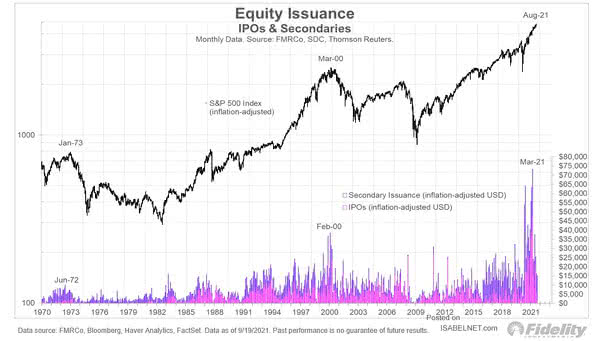
Equity Issuance – IPOs and Secondaries New equity offerings are booming. Are they in a bubble? Image: Fidelity Investments
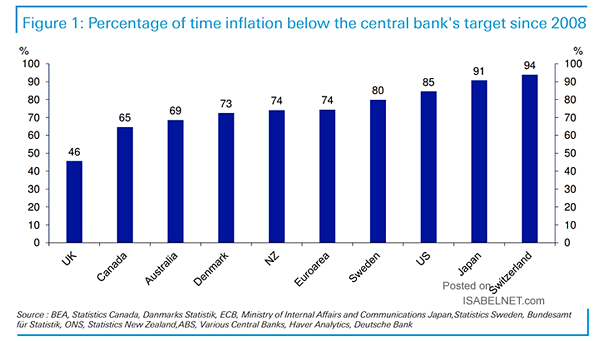
Percentage of Time Inflation Below the Central Bank’s Target Is inflation targeting by central banks an effective monetary policy strategy? Image: Deutsche Bank
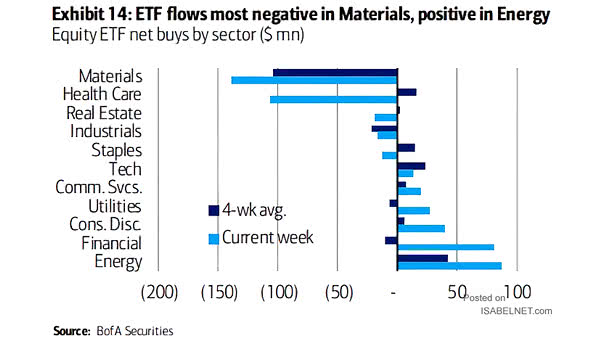
ETF Flows – Equity ETF Net Buy by Sector Investors continue to put their money into the energy sector. Image: BofA Securities