Consensus Dividend Growth YoY by Sector
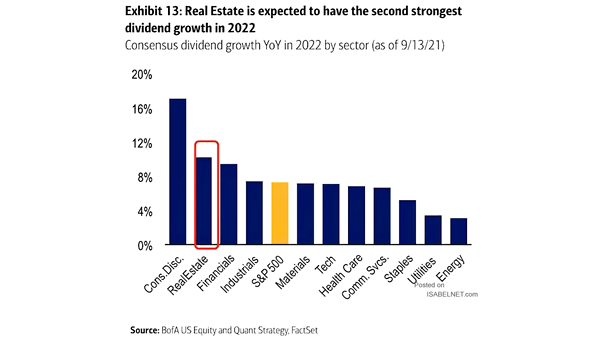
Consensus Dividend Growth YoY by Sector Real estate dividends are expected to increase by 10% in 2022. Image: BofA US Equity & Quant Strategy
Consensus Dividend Growth YoY by Sector Real estate dividends are expected to increase by 10% in 2022. Image: BofA US Equity & Quant Strategy
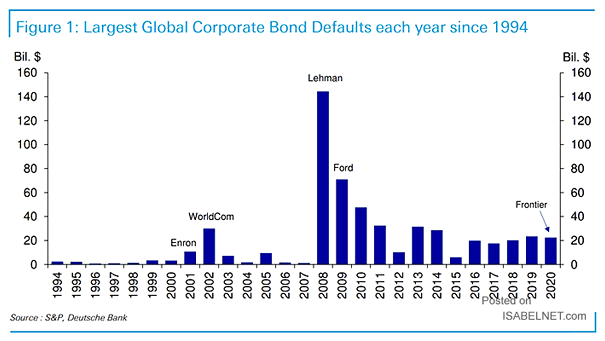
Largest Global Corporate Bond Defaults Evergrande could be the largest global corporate bond default this year. Image: Deutsche Bank
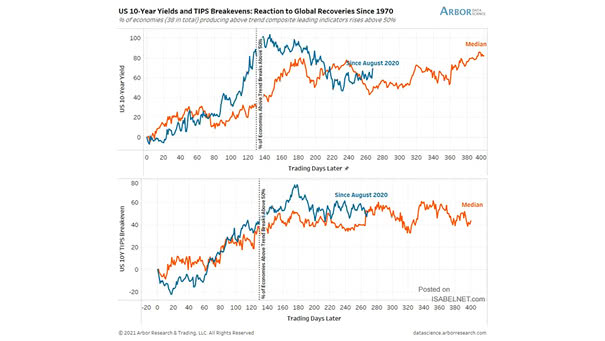
U.S. 10-Year Yield and U.S. 10-Year TIPS Breakeven So far, the U.S. 10-year yield and the U.S. 10-year TIPS breakeven continue to follow the historical pattern after global recoveries. Image: Arbor Research & Trading LLC
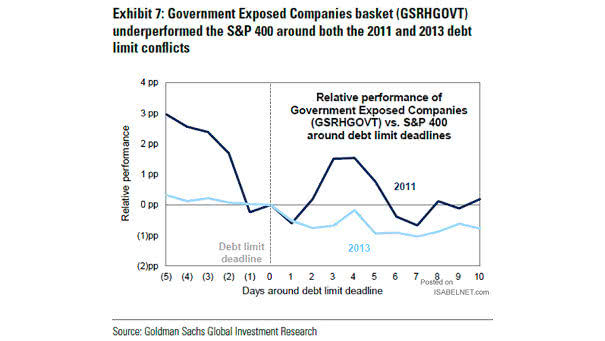
Relative Performance of Government Exposed Companies vs. S&P 400 around Debt Limit Deadlines Is a U.S. government shutdown imminent? Goldman Sachs doesn’t expect a government shutdown in October 2021. Image: Goldman Sachs Global Investment Research
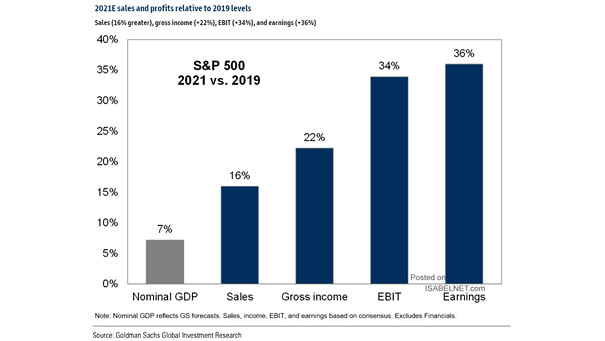
S&P 500 – 2021E Sales and Profits Relative to 2019 Levels Will earnings growth drive the S&P 500 higher by the end of 2021? Image: Goldman Sachs Global Investment Research
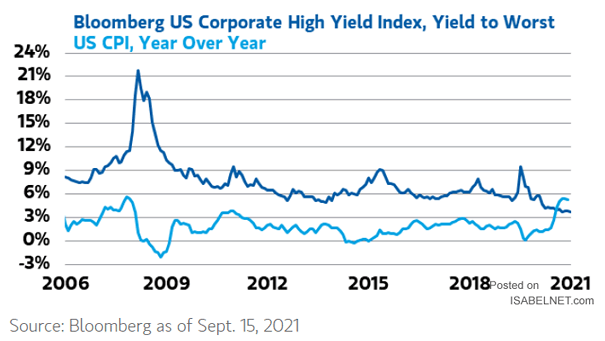
U.S. Corporate High Yield Bonds and U.S. CPI Currently, U.S. high yield bonds no longer compensate for U.S. inflation. Image: Morgan Stanley Wealth Management
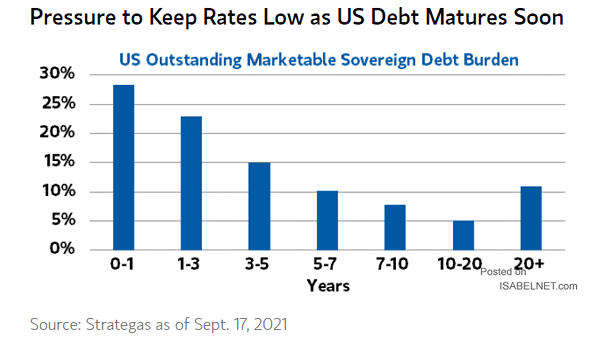
U.S. Outstanding Marketable Sovereign Debt Burden Investors still perceive U.S. debt to be safe for now, despite it is getting bigger and bigger. Image: Morgan Stanley Wealth Management
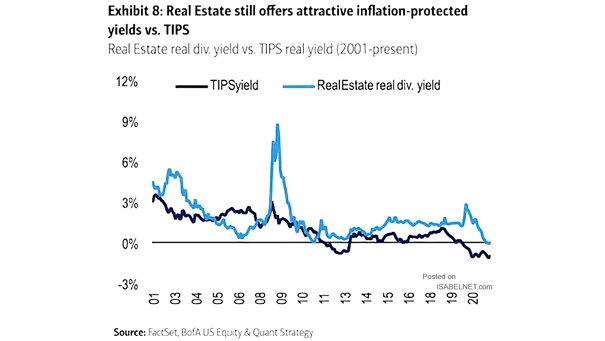
Inflation – Real Estate Real Dividend Yield vs. TIPS Real Yield Real estate real dividend yields remain attractive relative to TIPS real yields. Image: BofA US Equity & Quant Strategy
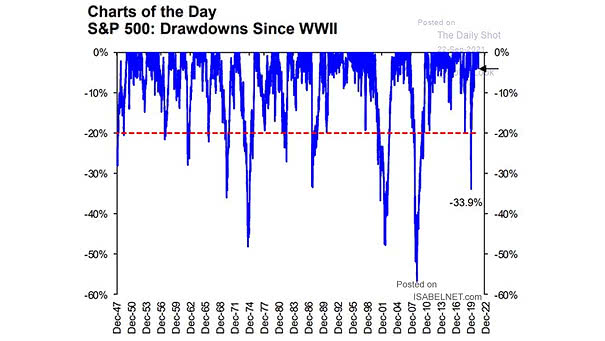
S&P 500 Drawdowns Since WWII Should investors expect a bigger drawdown before the end of the year? Image: Scotiabank GBM Portfolio Strategy
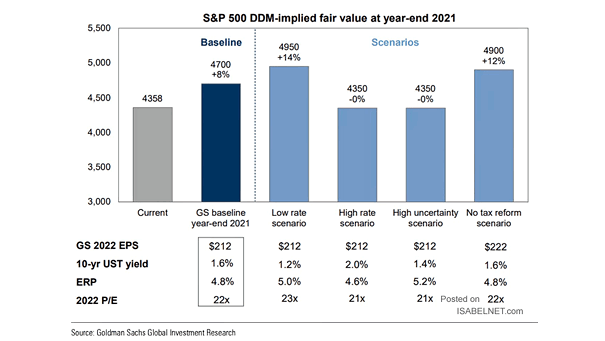
S&P 500 DDM-Implied Fair Value Goldman Sachs forecasts the U.S. 10-year Treasury yield at 1.6% by the end of 2021 and the S&P 500 to reach 4,700 (base case scenario). Image: Goldman Sachs Global Investment…
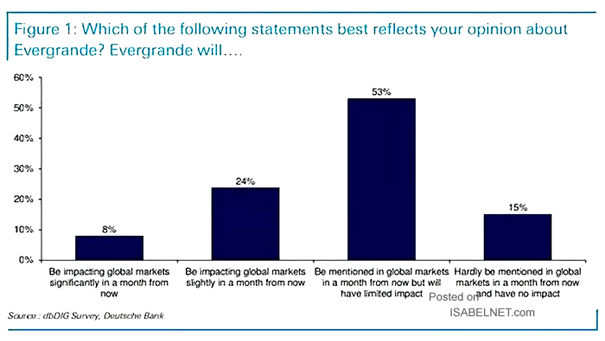
China – Evergrande and Global Markets (Survey) Will Evergrande have a limited impact on global markets? Image: Deutsche Bank