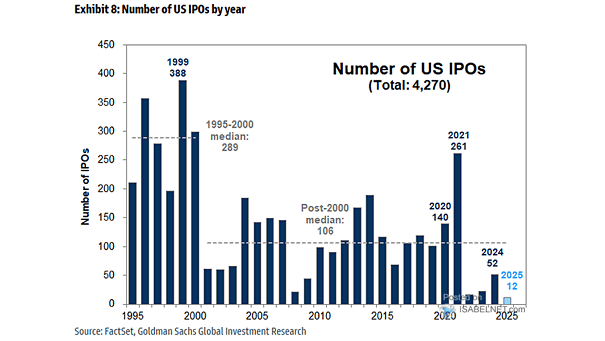
Number of U.S. IPOs

Number of U.S. IPOs 40 U.S. companies have gone public so far this year, while Goldman Sachs expects roughly 100 IPOs to raise about $160 billion in 2026. Geopolitical uncertainty and recent equity market volatility…

S&P 500 Performance – % Difference vs. the 200-DMA

S&P 500 Performance – % Difference vs. the 200-DMA The S&P 500 is trading about 11% above its 200-day moving average, not far from past peaks. The further it stretches, the more vulnerable it becomes…

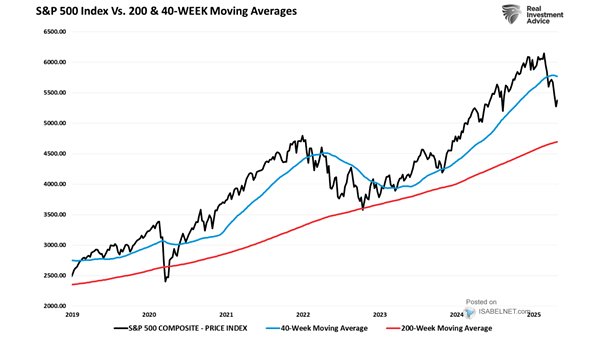
S&P 500 Index vs. 40-Week Moving Average

S&P 500 Index vs. 40-Week Moving Average The 40-week moving average offers a straightforward way to manage S&P 500 exposure. Add risk when the index trades above it. Trim risk when it falls below. Process…

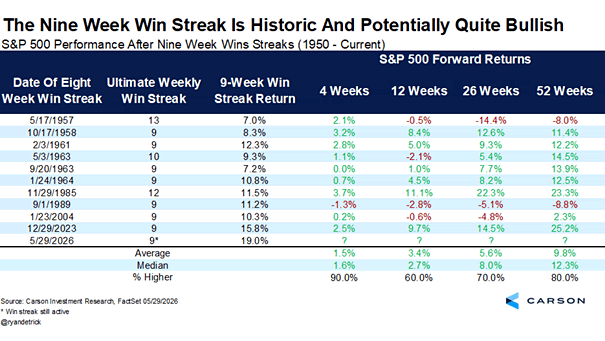
S&P 500 Performance After Nine Week Wins Streaks

S&P 500 Performance After Nine Week Wins Streaks A 9-week win streak tends to have legs. In 9 out of 10 cases, the S&P 500 has moved higher in the next month, suggesting June could…

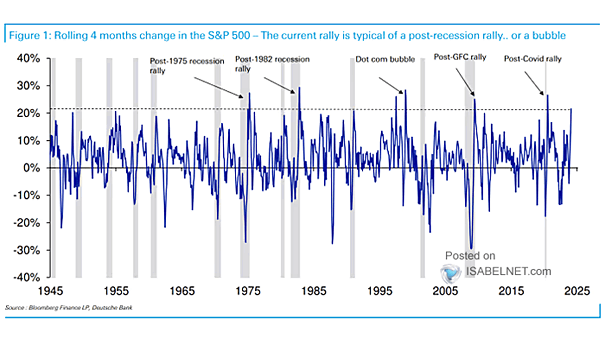
Two-Month Change in the S&P 500 Since WWII

Two-Month Change in the S&P 500 Since WWII Since WWII, two-month rallies of this magnitude in the S&P 500 have been rare, typically appearing either in the rebound from recessions such as the GFC and…

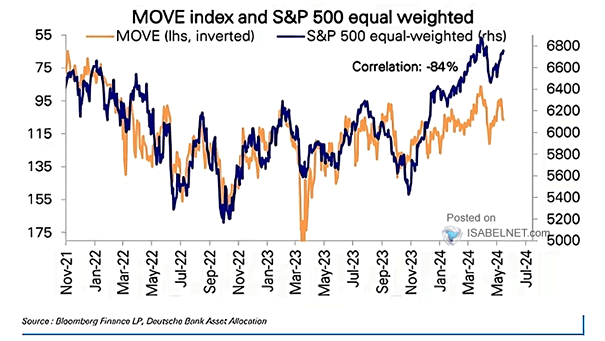
MOVE Index vs. U.S. 10-Year Note

MOVE Index vs. U.S. 10-Year Note Unlike in 2022, U.S. 10-year yields are higher year to date, but rate volatility has stayed contained. Implied and realized volatility remain compressed even as inflation risks and Fed…