Inequality – U.S. Households’ Share of Excess Savings
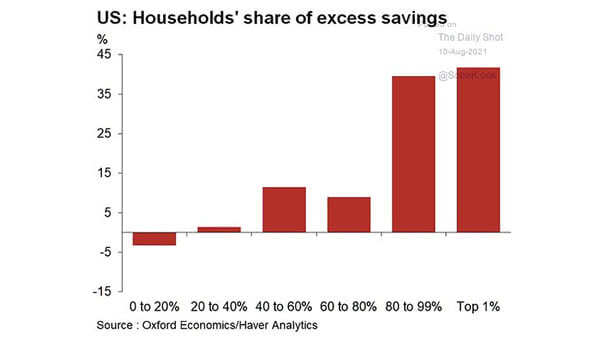
Inequality – U.S. Households’ Share of Excess Savings U.S. households’ excess savings are going to the wealthy. Could excess savings drive the U.S. stock market higher? Image: Oxford Economics
Inequality – U.S. Households’ Share of Excess Savings U.S. households’ excess savings are going to the wealthy. Could excess savings drive the U.S. stock market higher? Image: Oxford Economics
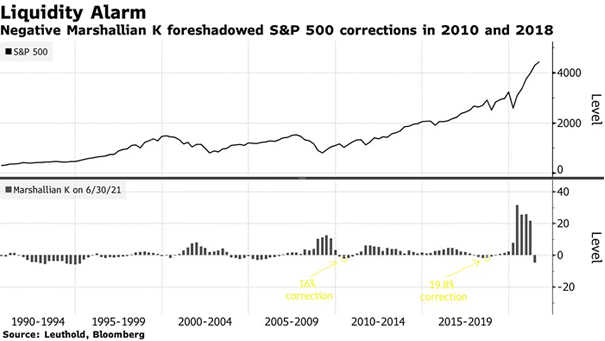
Correction – S&P 500 and Marshallian K With U.S. GDP growing faster than M2 money supply, the S&P 500 is vulnerable to a correction. Image: Bloomberg
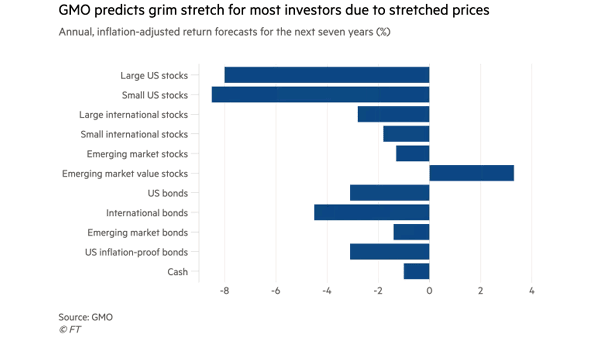
Annual Inflation-Adjusted Return Forecasts for the Next Seven Years Should investors expect anemic real returns over the next 7 years? Image: Financial Times
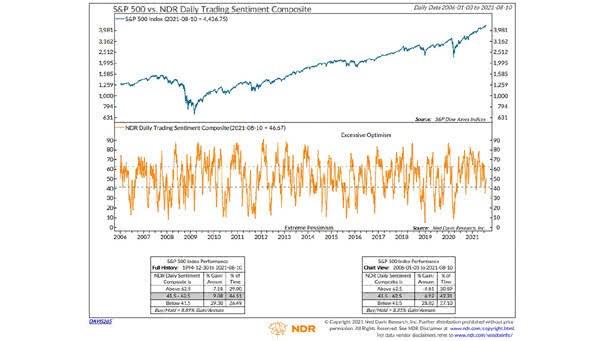
S&P 500 vs. Daily Trading Sentiment Composite The NDR daily trading sentiment composite is neutral. How high will the S&P 500 climb by year-end? Image: Ned Davis Research
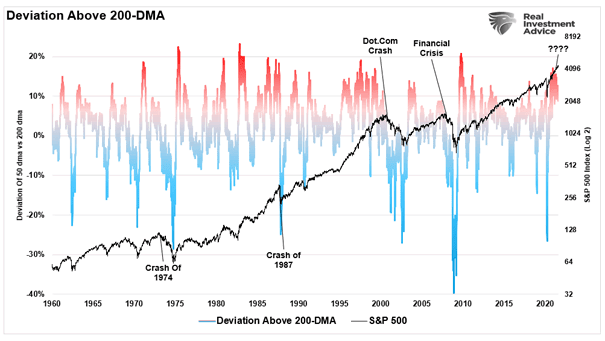
S&P 500 and Deviation Above 200-Day Moving Average The S&P 500 index is currently more than 11% above its 200-day moving average. Is a market correction on the horizon? Image: Real Investment Advice
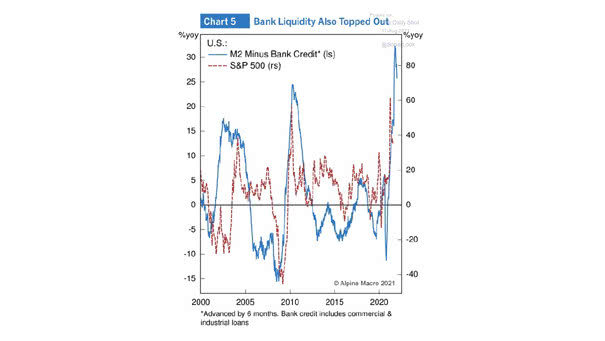
S&P 500 and U.S. M2 Minus Bank Credit (Leading Indicator) U.S. M2 minus bank credit tends to lead the S&P 500 by 6 months. Image: Alpine Macro
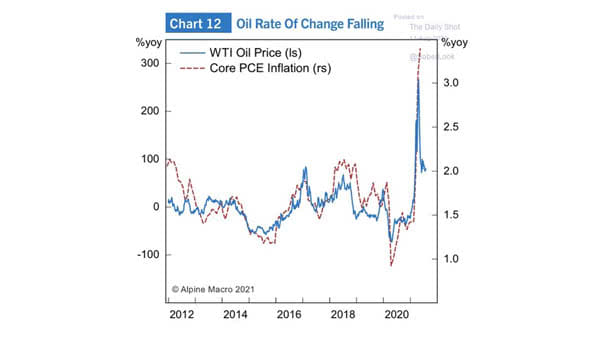
WTI Oil Price and Core PCE Inflation Oil prices tend to be closely linked to inflation. Image: Alpine Macro
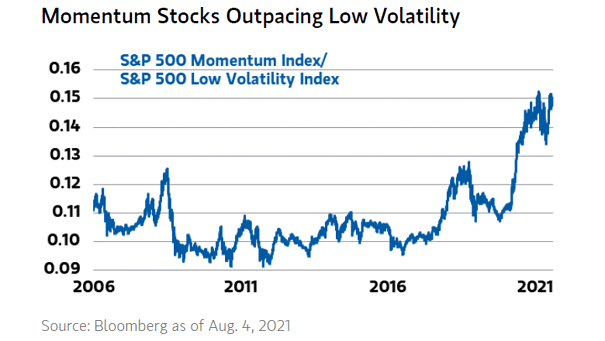
S&P 500 Momentum Index / S&P 500 Low Volatility Index Momentum stocks are outpacing low volatility stocks. Are investors concerned of higher market fragility? Image: Morgan Stanley Wealth Management

S&P 500 Companies’ Mentions of “Inflation” per Earnings Call S&P 500 company mentions of “inflation” jumped 900% year-over-year. Can the Federal Reserve really fix this by printing more money? Image: BofA Global Research
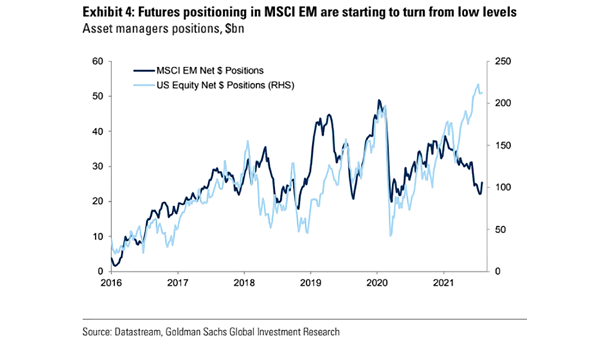
Equities – MSCI EM Net $ Positions and U.S. Equity Net $ Positions Futures positioning in U.S. equities remain high. Image: Goldman Sachs Global Investment Research
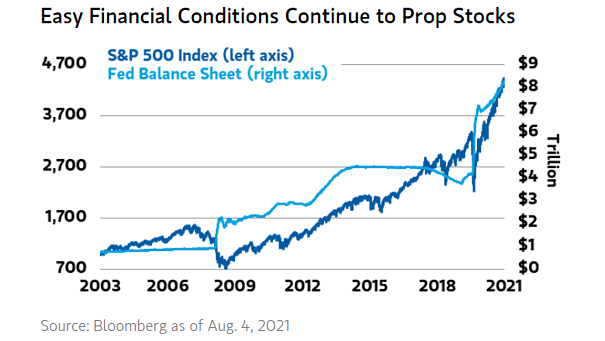
S&P 500 Index and Fed Balance Sheet The growth of the Fed’s balance sheet tends to push the S&P 500 Index higher. Image: Morgan Stanley Wealth Management