VIX Seasonal Composite
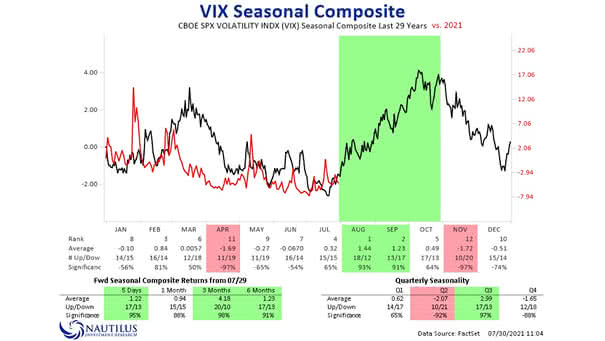
VIX Seasonal Composite Historically, August-October tends to see increased risk of VIX spikes. Image: Nautilus Research
VIX Seasonal Composite Historically, August-October tends to see increased risk of VIX spikes. Image: Nautilus Research
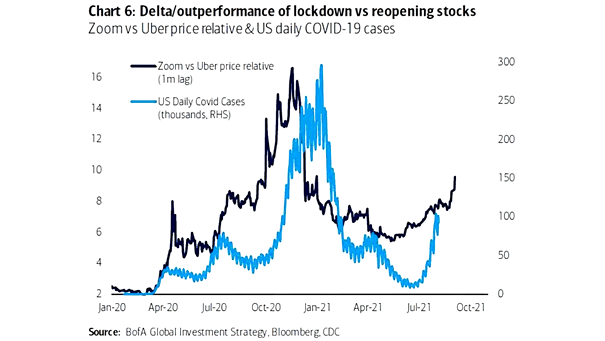
Performance – Zoom vs. Uber Price Relative and U.S. Daily COVID-19 Cases Will the outperformance of lockdown stocks vs. reopening stocks continue amid Delta variant worries? Image: BofA Global Investment Strategy
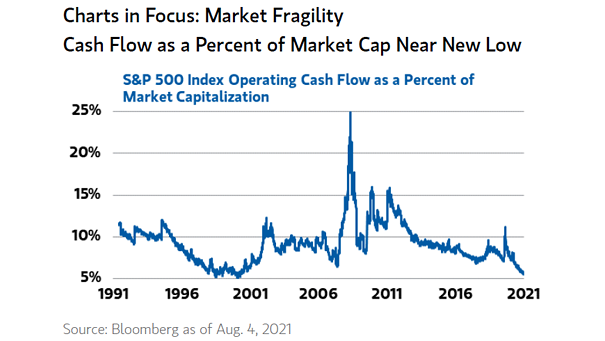
S&P 500 Index Operating Cash Flow as a Percent of Market Capitalization Market fragility remains elevated. Cash flow as a percent of market cap is close to the dotcom bubble low. Image: Morgan Stanley Wealth…
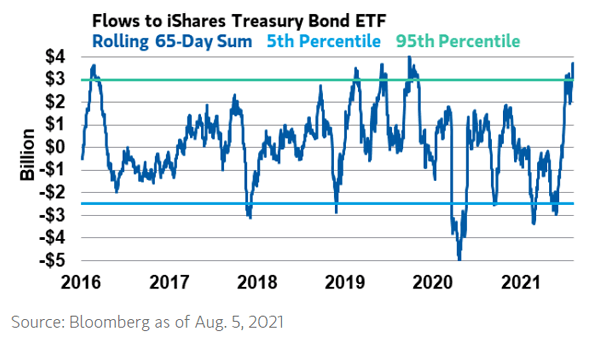
Flows to Treasury Bond ETF U.S. Treasury bond technicals are extreme. Image: Morgan Stanley Wealth Management
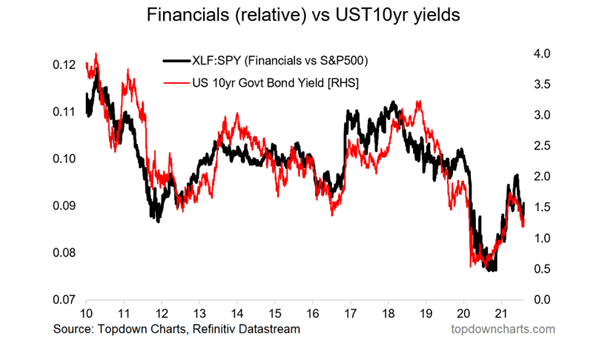
Financials vs. S&P 500 and U.S. 10-Year Treasury Yields The relative performance of U.S. banks tends to track U.S. 10-year Treasury rates. Rising bond yields would be good news for financial stocks. Image: Topdown Charts
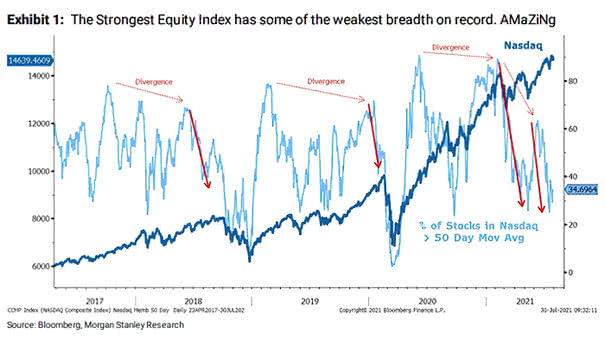
Breadth – % of Stocks in Nasdaq Above 50-Day Moving Average Is it time to reduce exposure to tech stocks, as the Nasdaq breadth has not matched the rise in the index? Image: Morgan Stanley…
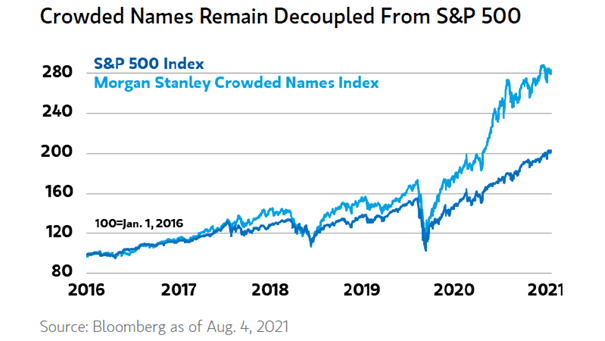
Returns – S&P 500 Index and Crowded Names The gap between the S&P 500 Index and crowded names has been widening since 2020. Image: Morgan Stanley Wealth Management
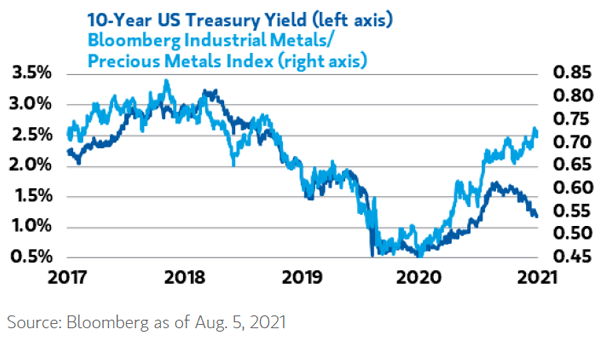
U.S. 10-Year Treasury Yield and Industrial Metals/Precious Metals Index Historically, U.S. rates tend to rise when growth is strong, as it is today. Image: Morgan Stanley Wealth Management
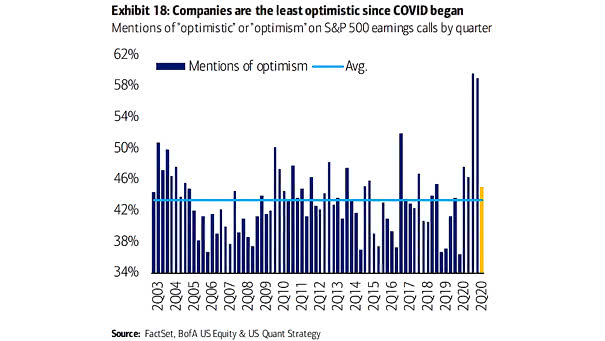
Mention of “Optimistic” or “Optimism” on S&P 500 Earnings Calls by Quarter S&P 500 companies are becoming less optimistic. Image: BofA US Equity & Quant Strategy
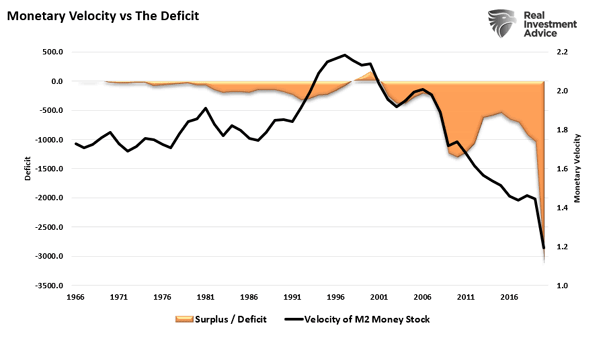
Velocity of M2 Money Stock in the U.S. vs. The U.S. Deficit The rise in the U.S. deficit has coincided with a collapse in M2 velocity. Image: Real Investment Advice
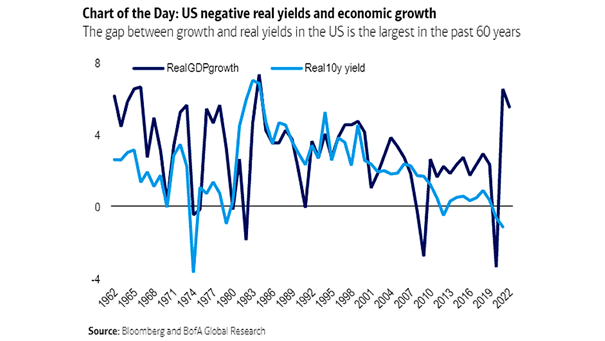
Real U.S. 10-Year Yield and U.S. Real GDP Growth Will U.S. real yields remain negative despite a strong U.S. economic recovery? Image: BofA Global Research