Annual Inflation-Adjusted Return Forecasts for the Next Seven Years
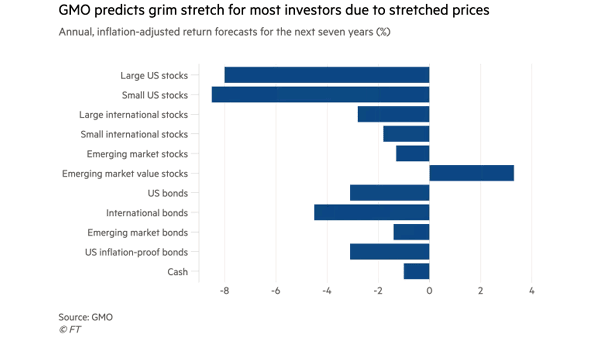
Annual Inflation-Adjusted Return Forecasts for the Next Seven Years Should investors expect anemic real returns over the next 7 years? Image: Financial Times
Annual Inflation-Adjusted Return Forecasts for the Next Seven Years Should investors expect anemic real returns over the next 7 years? Image: Financial Times
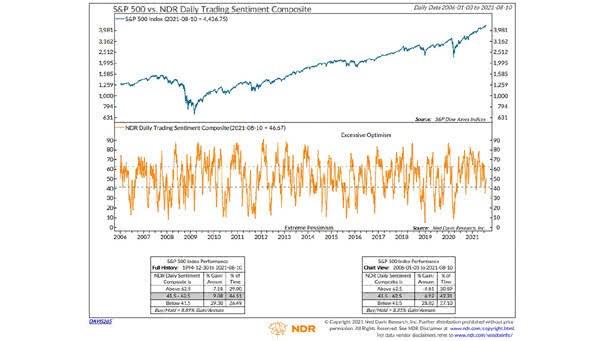
S&P 500 vs. Daily Trading Sentiment Composite The NDR daily trading sentiment composite is neutral. How high will the S&P 500 climb by year-end? Image: Ned Davis Research
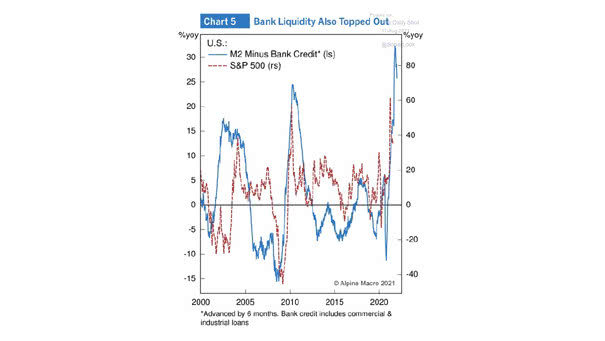
S&P 500 and U.S. M2 Minus Bank Credit (Leading Indicator) U.S. M2 minus bank credit tends to lead the S&P 500 by 6 months. Image: Alpine Macro
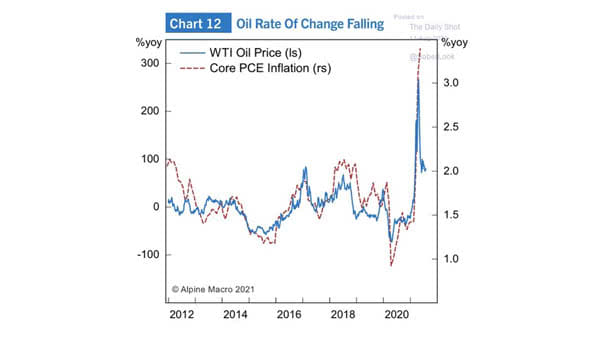
WTI Oil Price and Core PCE Inflation Oil prices tend to be closely linked to inflation. Image: Alpine Macro

S&P 500 Companies’ Mentions of “Inflation” per Earnings Call S&P 500 company mentions of “inflation” jumped 900% year-over-year. Can the Federal Reserve really fix this by printing more money? Image: BofA Global Research
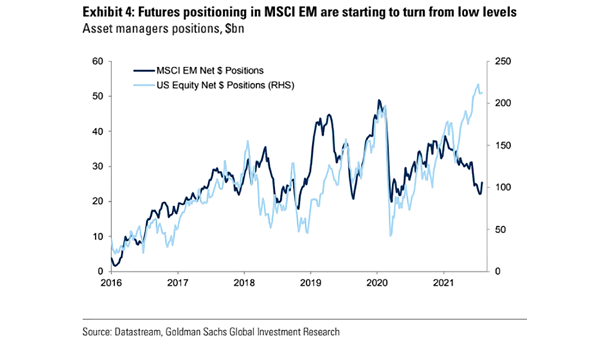
Equities – MSCI EM Net $ Positions and U.S. Equity Net $ Positions Futures positioning in U.S. equities remain high. Image: Goldman Sachs Global Investment Research
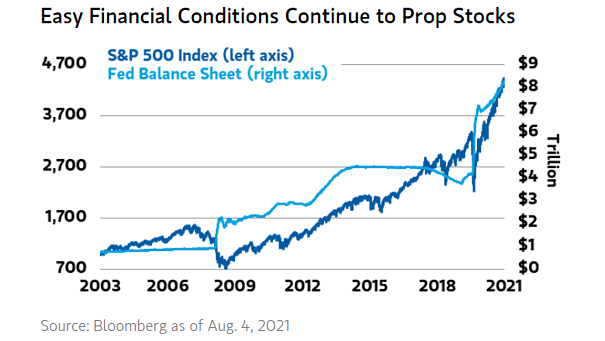
S&P 500 Index and Fed Balance Sheet The growth of the Fed’s balance sheet tends to push the S&P 500 Index higher. Image: Morgan Stanley Wealth Management
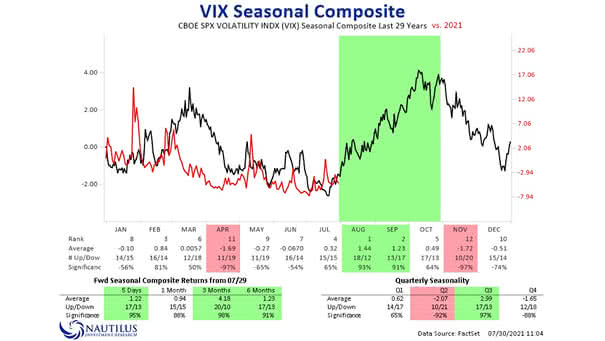
VIX Seasonal Composite Historically, August-October tends to see increased risk of VIX spikes. Image: Nautilus Research
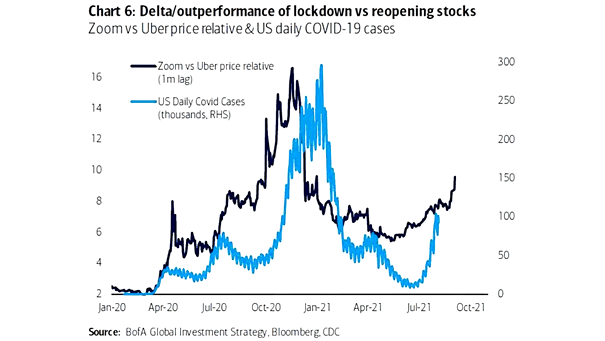
Performance – Zoom vs. Uber Price Relative and U.S. Daily COVID-19 Cases Will the outperformance of lockdown stocks vs. reopening stocks continue amid Delta variant worries? Image: BofA Global Investment Strategy
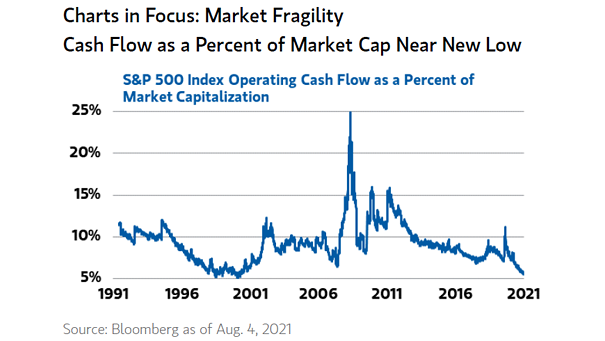
S&P 500 Index Operating Cash Flow as a Percent of Market Capitalization Market fragility remains elevated. Cash flow as a percent of market cap is close to the dotcom bubble low. Image: Morgan Stanley Wealth…
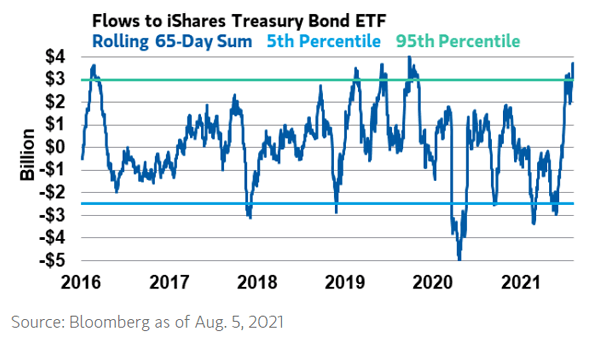
Flows to Treasury Bond ETF U.S. Treasury bond technicals are extreme. Image: Morgan Stanley Wealth Management