Bitcoin – Number of Cryptocurrencies Worldwide
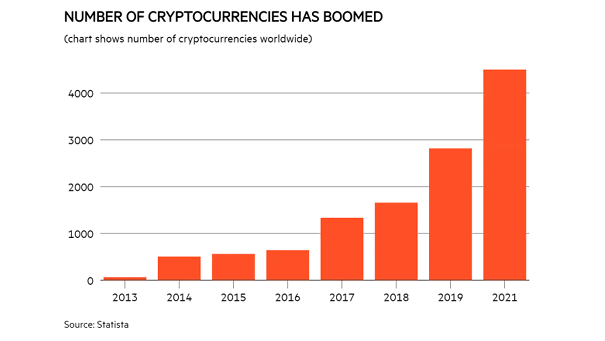
Bitcoin – Number of Cryptocurrencies Worldwide The number of cryptocurrencies has skyrocketed. But the top 20 cryptocurrencies account for nearly 90% of the total market. Image: Financial Times
Bitcoin – Number of Cryptocurrencies Worldwide The number of cryptocurrencies has skyrocketed. But the top 20 cryptocurrencies account for nearly 90% of the total market. Image: Financial Times
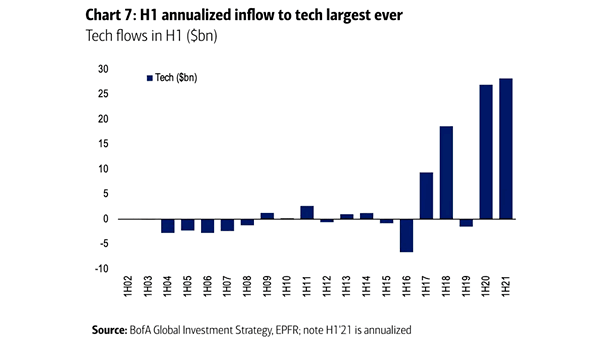
Tech Flows in H1 Will investors’ love of tech stocks continue? Image: BofA Global Investment Strategy
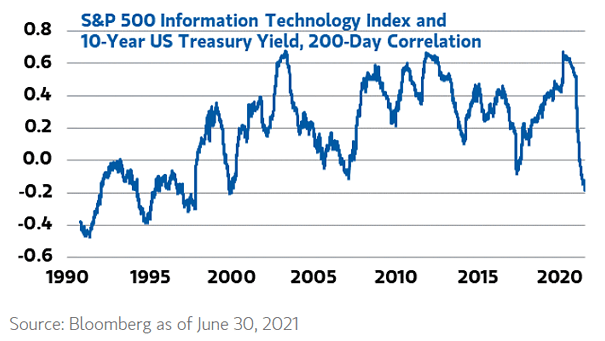
Tech Stocks – S&P 500 Information Technology Index and 10-Year U.S. Treasury Yield – 200-Day Correlation How much should tech stocks trade like bond proxies? Can high concentration in tech stocks increase market fragility? Image:…
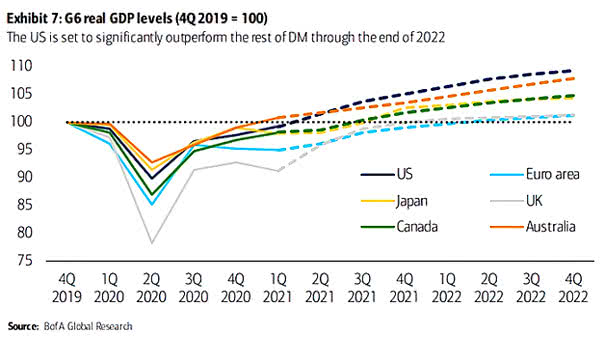
G6 Real GDP Levels The U.S. economy is growing pretty solidly and is expected to outperform the rest of DM through the end of 2022. Image: BofA Global Research
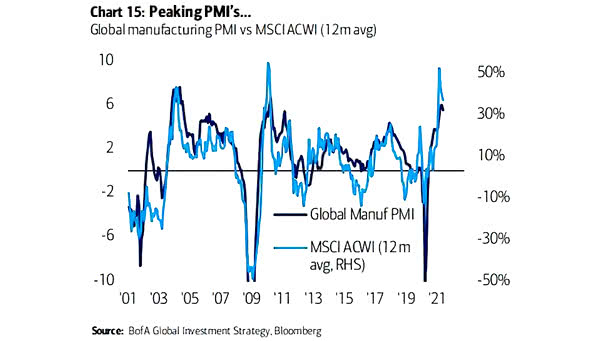
Global Manufacturing PMI vs. MSCI ACWI PMI’s are peaking. Historically, markets tend to lead the macro for most time periods. Image: BofA Global Investment Strategy
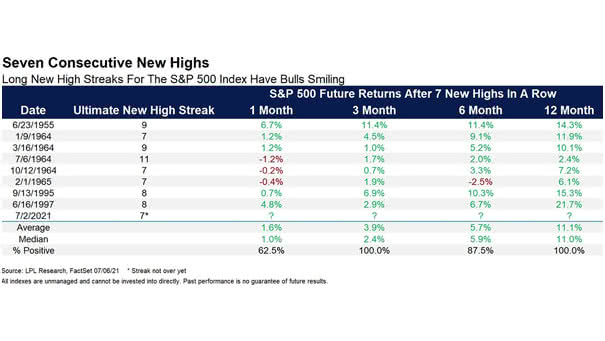
S&P 500 Future Returns After 7 New Highs in a Row Historically, after seven consecutive new all-time highs, it tends to be bullish for the S&P 500 Index over the next 12 months. Image: LPL…
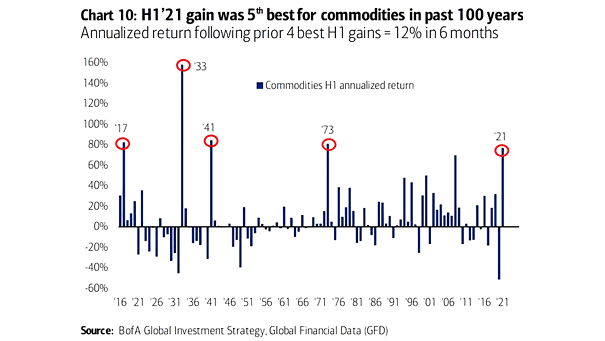
Commodities H1 Annualized Return How will commodities perform for the rest of the year? Image: BofA Global Investment Strategy
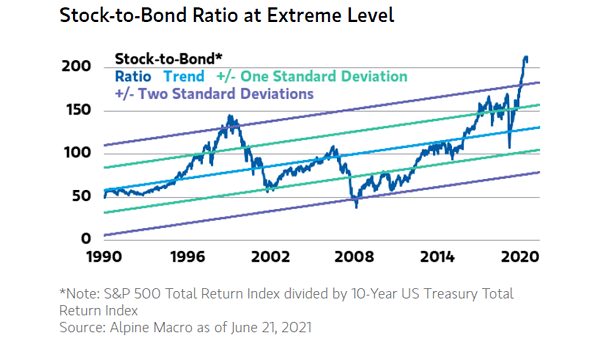
Equity/Bond Performance – Stock-to-Bond Ratio Should investors be worried that the stock-to-bond ratio is at an extreme level? Image: Morgan Stanley Wealth Management
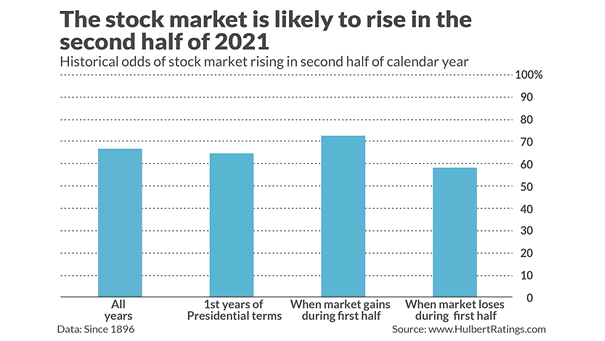
Historical Odds of U.S. Stock Market Rising in Second Half of Calendar Year Is there a good chance that the U.S. stock market will be higher at the end of this year? Image: Marketwatch
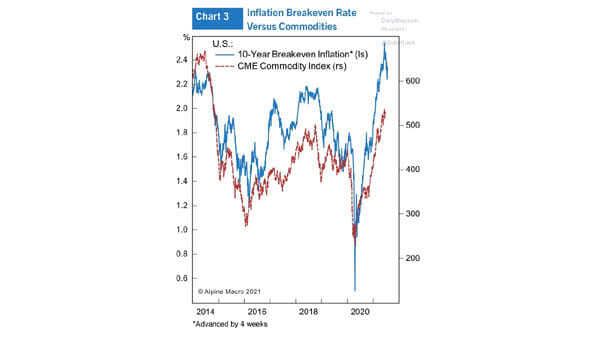
U.S. 10-Year Breakeven Inflation vs. Commodities (Leading Indicator) Is a commodity price correction imminent? Image: Alpine Macro
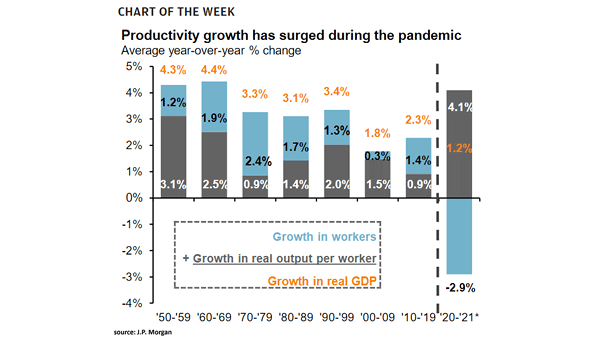
Productivity Growth in the U.S. The coronavirus pandemic has boosted productivity in the United States and helps explain some of the strong gains in the stock market. Image: J.P. Morgan Asset Management