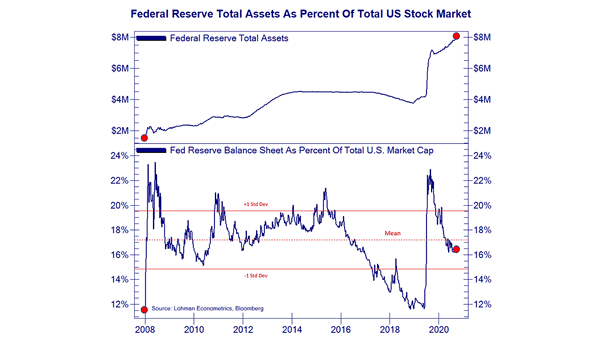
4-Week U.S. Dollar Flows
4-Week U.S. Dollar Flows Will the U.S. dollar sell-off continue? Image: BofA Global Research
Comparing Wilshire U.S. Large, Mid and Small-Cap Total Return Indices Compared to large- and small-caps, mid-caps tend to deliver better returns. Image: BofA ETF Research
Flows – Rolling Four-Week Average Net Buys of Tech Stocks BofA’s clients are selling tech stocks after record inflows. Image: BofA Securities
Performance – Non-Profitable Tech, Liquid IPOs and Bitcoin Sensitive Stocks Speculative parts of the market are taking big hits. Image: Financial Times
European Stocks – MSCI Europe Index Two-Year Forward P/E Premium to MSCI All Country Worl Index European stocks remain cheap relative to their global peers. Image: Morgan Stanley Wealth Management
Current Value Cycle vs. Historic Value Cycles Historically, Value cycle tends to last 33 months and Value tends to outperform Growth by about 60% on average. Image: BofA US Equity & Quant Strategy
Growth vs. Value – Based Relative Median Price to Forward Earnings Ratio Growth continues to trade above its historical average vs. Value. Image: BofA US Equity & Quant Strategy
S&P 500 and Investment Grade Bonds The divergence between investment grade bonds and the S&P 500 tends to be a bearish signal for the S&P 500. Image: BofA Global Research
S&P 500 3-Month Implied Volatility and U.S. 10-Year 3-Month Implied Volatility The volatility gap between U.S. equity and U.S. rates has now closed. Image: Goldman Sachs Global Investment Research
Valuation – Fed Assets vs. S&P 500 Fwd P/E Fed assets tend to push the valuation of the S&P 500 higher. Image: Lohman Econometrics
Valuation of the S&P 500 and the Top 5 Stocks Relative to Interest Rates The earnings yield gap for the top 5 stocks is 191 bp, just above the 40-year average of 144 bp. Image:…