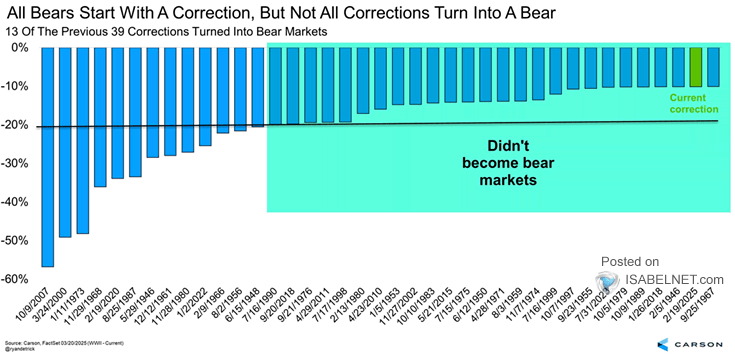
S&P 500 – Corrections vs. Bear Markets
S&P 500 – Corrections vs. Bear Markets The S&P 500 now stands roughly 83% above its long-term trend, with the Shiller CAPE close to 42. Even a 20% selloff would fall short of signaling a…
S&P 500 – Corrections vs. Bear Markets The S&P 500 now stands roughly 83% above its long-term trend, with the Shiller CAPE close to 42. Even a 20% selloff would fall short of signaling a…
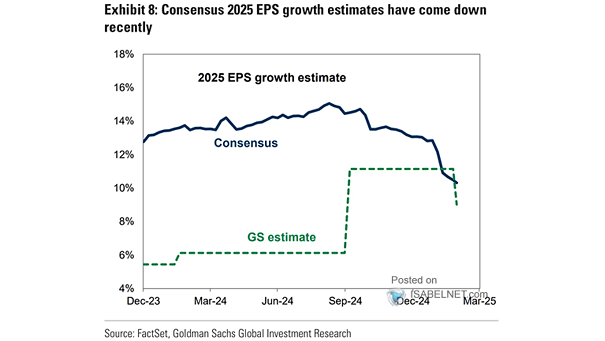
Estimated S&P 500 EPS and Y/Y Growth Goldman Sachs is betting the earnings strength has legs, forecasting S&P 500 EPS growth of 24% in 2026 to $340, followed by 13% in 2027 to $385. If…
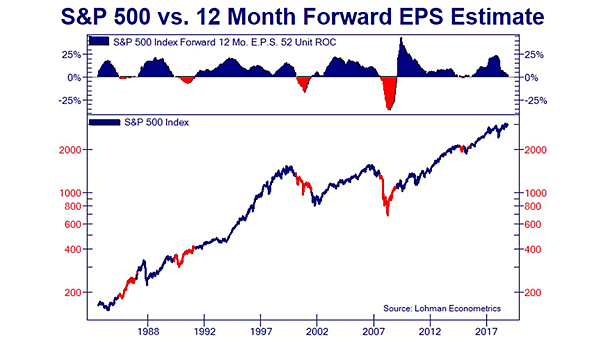
Indexed Market Cap and Consensus Fwd 12m EPS Estimates for S&P 500 Companies Earnings momentum is driving the AI infrastructure complex’s outperformance so far this year, with capital flowing to names that are already translating…
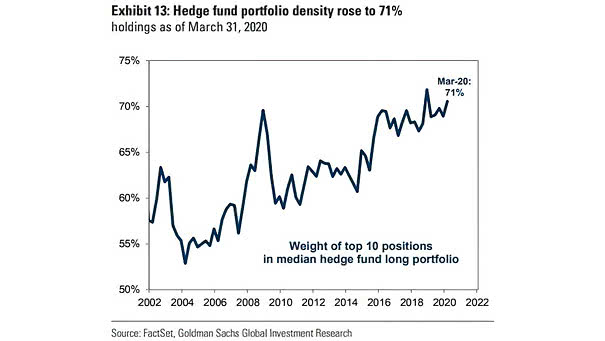
Weight of Top 10 Positions in Median Hedge Fund Long Portfolio Hedge fund portfolio density is now at 72% and holding firm, with greater concentration in top 10 positions. Such concentration leaves markets vulnerable to…
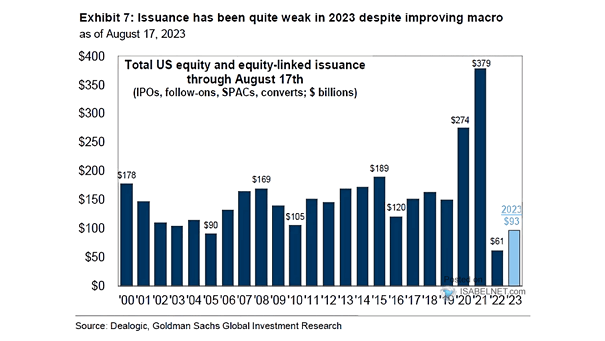
Annual U.S. Equity Issuance as % of Russell 3000 Market Cap “$600 billion in U.S. equity issuance in 2026” grabs attention and feeds the doom narrative. But relative to the total value of U.S. equities,…
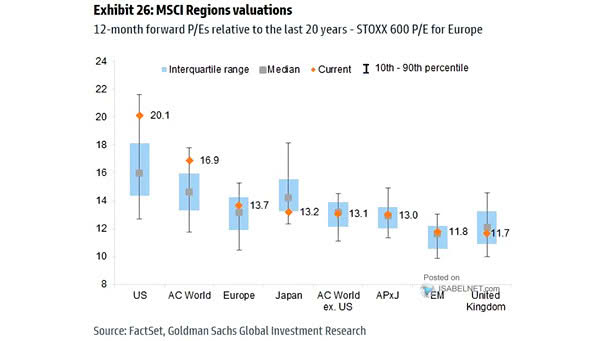
Equities – Global Valuation Range U.S. stocks carry a rich premium, while markets abroad sit closer to their historical ranges. The result is a global landscape where relative value is easier to find outside the…
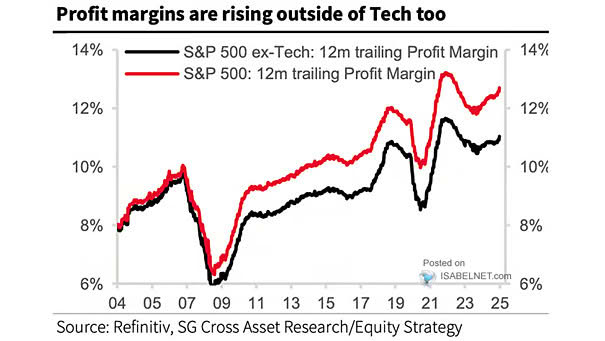
S&P 500 Net Profit Margin Profit margins are widening across the S&P 500 this year, extending beyond mega-caps and the tech sector. This trend should continue into 2027, pointing to a healthier and more diverse…
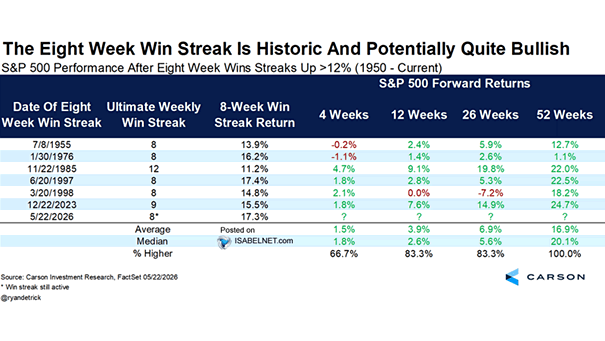
S&P 500 Performance After Eight Week Wins Streaks Up >12% An eight-week winning streak and a rise of more than 12% set the tone. Since 1950, U.S. stocks have followed up with a median 12-month…
S&P 500 Performance Around Issuance Upcycles Past issuance waves tell a familiar story: they usually line up with strong U.S. equity performance, underpinned by steady buying interest. That pattern is tough to ignore in a…
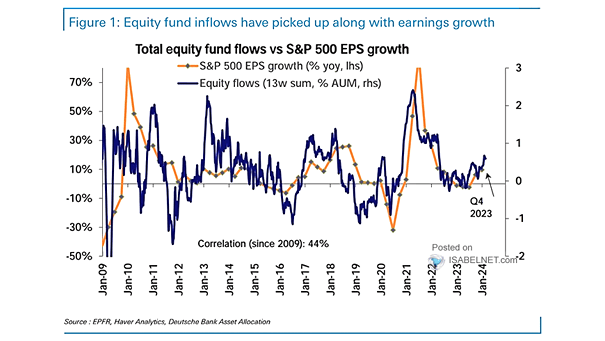
Equity Fund Flows vs. S&P 500 EPS Growth Investors are pouring into equities on the back of solid earnings momentum. As long as earnings hold up, the trend should carry on. Image: Deutsche Bank Asset…
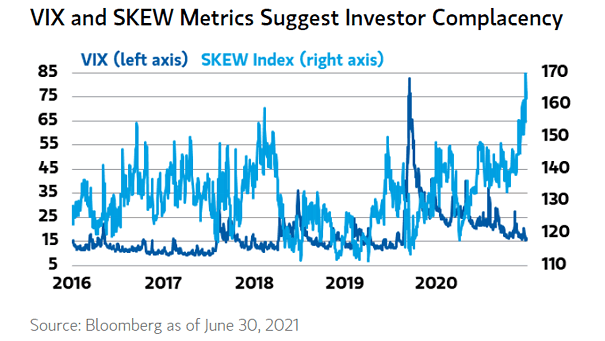
Volatility – VIX and SKEW Index The VIX–SKEW divergence is less about calm and more about caution. Volatility looks subdued, but the steady rise in SKEW suggests investors are quietly paying up for protection against…