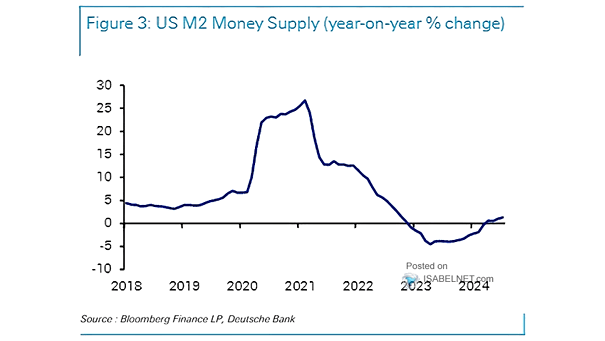
U.S. M2 Money Creation by Year
U.S. M2 Money Creation by Year All signs point to a 2026 liquidity wave: bigger money funds, solid bank credit, and $40 billion a month from the Fed in T‑bill buys. That could juice reserves, pump…
U.S. M2 Money Creation by Year All signs point to a 2026 liquidity wave: bigger money funds, solid bank credit, and $40 billion a month from the Fed in T‑bill buys. That could juice reserves, pump…
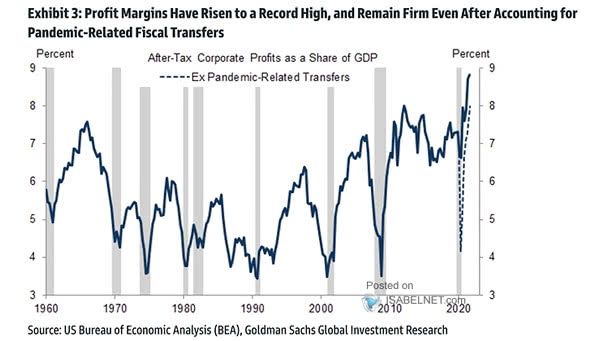
U.S. Corporate Profits as % of Real GDP U.S. corporate profits are running far ahead of real economy growth, reaching the widest gap on record. History shows that such divergences rarely last once markets face…
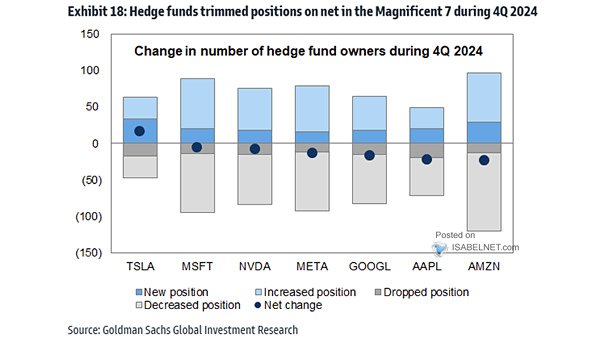
Magnificent Seven Stocks – Projected Gain or Decline Over the Next 12 Months Analysts expect the Magnificent 7 to remain the main engine of S&P 500 earnings growth in 2026, with forecasts calling for solid…
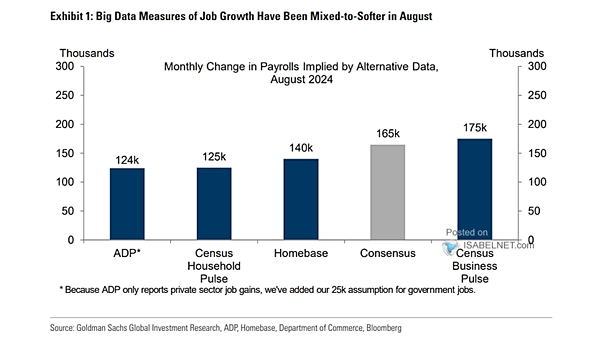
U.S. Payrolls and Recessions U.S. payroll growth rarely dips this low without a recession. It slowed sharply in late 2025, but analysts expect a rebound this year as productivity gains, Fed rate cuts, and fiscal…
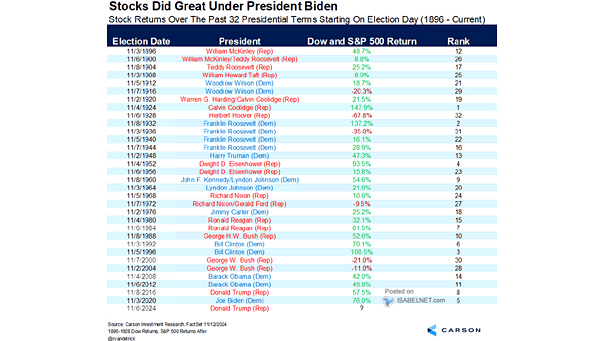
S&P 500 – U.S. Stock Returns Over the Past 22 Presidents Nearly a year into Trump’s presidency, the S&P 500 has surged more than 16%, shaking off tariff headwinds. Bulls are smiling, betting on robust…
Top-Down Estimates of Earnings per Share Growth (S&P 500, STOXX 600, TOPIX, MXAPJ) After years of rallies fueled by soaring multiples, especially in tech and AI sectors, 2026 could see fundamentals take the lead. Image:…
U.S. Financial Sector’s Profit vs. Labour Demand With so much of finance built on information processing, the sector may soon stand as the clearest example of how AI can lift earnings without lifting headcount. Image:…
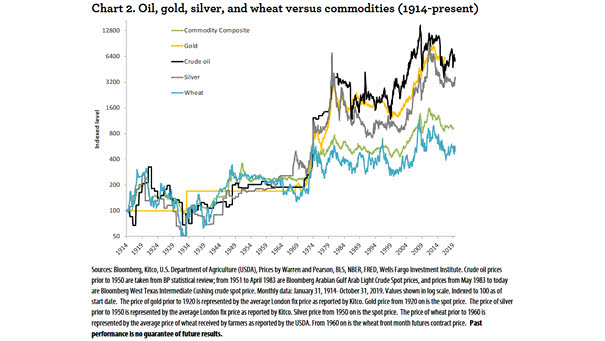
Silver to Oil Ratio Silver’s rally has gone so far that an ounce can now buy a barrel of oil. It’s a rare moment that may not last if crude recovers or silver takes a…
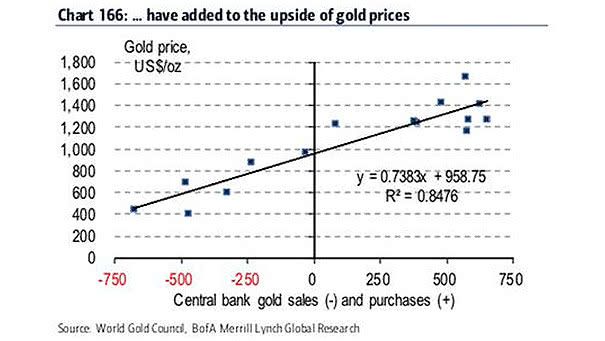
Performance for Gold Gold often starts the year strong, with January usually one of its best months as post-holiday portfolio adjustments and fresh investment flows boost demand. Image: Deutsche Bank
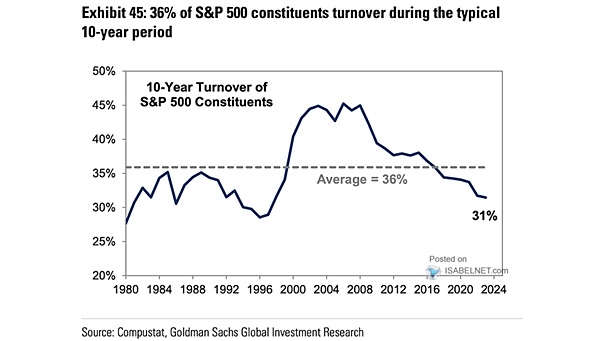
5-Year Turnover of S&P 500 Constituents In a typical five-year stretch, about 20% of S&P 500 members turn over, a reminder of how tough it is to stay in the game for the long haul.…
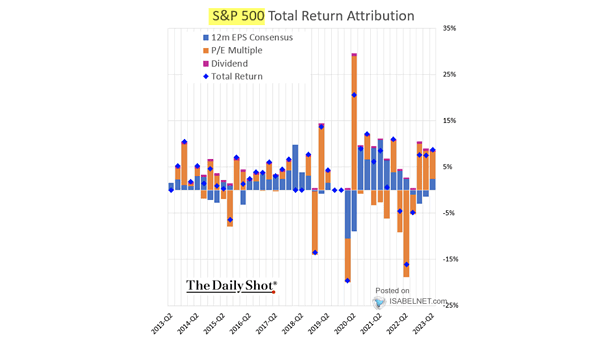
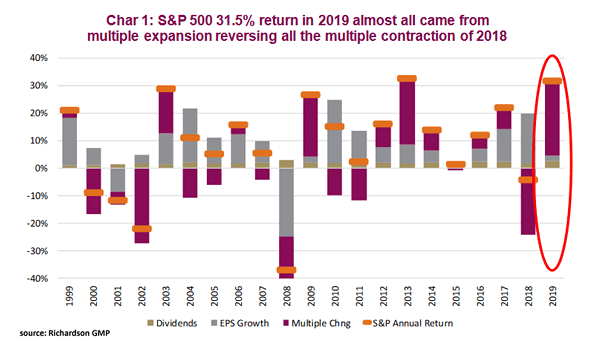
Components of S&P 500 Total Return Corporate profits carried much of the load for the S&P 500 in 2025, powering most of the index’s gains. In 2026, earnings look set to stay behind the wheel,…