Model Estimates for WTI Crude Oil
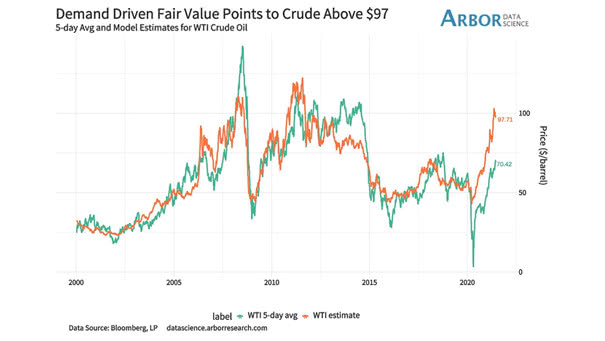
Model Estimates for WTI Crude Oil Should investors expect higher oil prices, as vaccines should end the pandemic? Image: Arbor Research & Trading LLC
Model Estimates for WTI Crude Oil Should investors expect higher oil prices, as vaccines should end the pandemic? Image: Arbor Research & Trading LLC
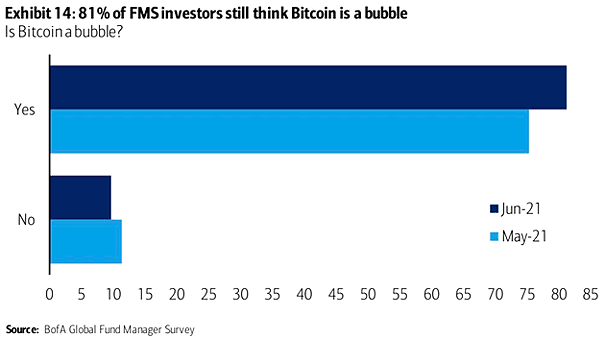
Is Bitcoin a Bubble? 81% of FMS investors think so. Image: BofA Global Fund Manager Survey
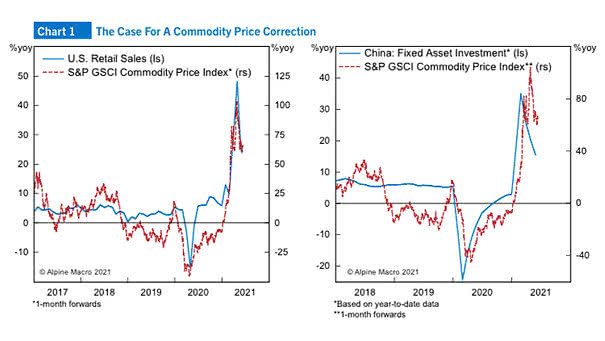
Commodities – The Case for a Commodity Price Correction With a more hawkish Fed, should investors expect a commodity price correction? Image: Alpine Macro
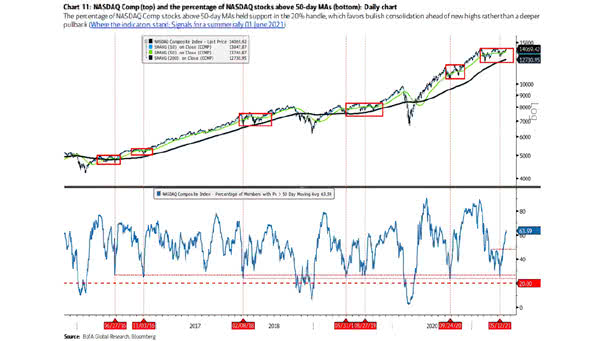
Nasdaq Composite and the Percentage of Nasdaq Stocks Above 50-Day Moving Averages Should investors expect a move to new highs for the Nasdaq? Image: BofA Global Research
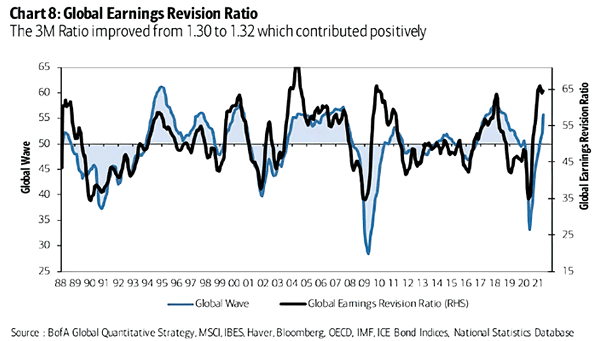
Global Earnings Revision Ratio The global earnings revision ratio is still improving. Image: BofA Global Quantitative Strategy
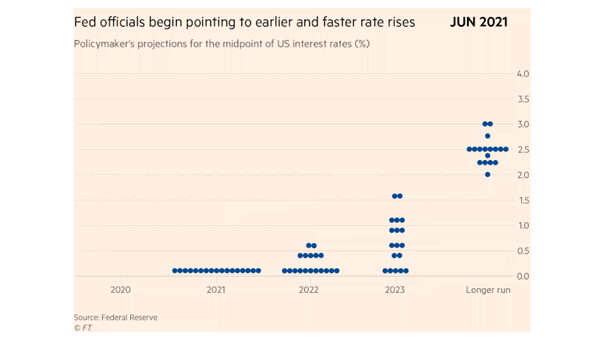
Fed – Policymaker’s Projections for the Midpoint of U.S. Interest Rates The Fed forecasts first rate hikes in 2023. Image: Financial Times
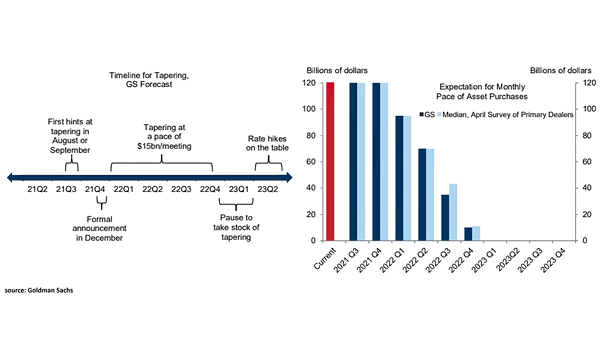
Fed – Expectation for the Tapering Timeline Is it time to talk about tapering quantitative easing and rate hikes? Image: Goldman Sachs Global Investment Research
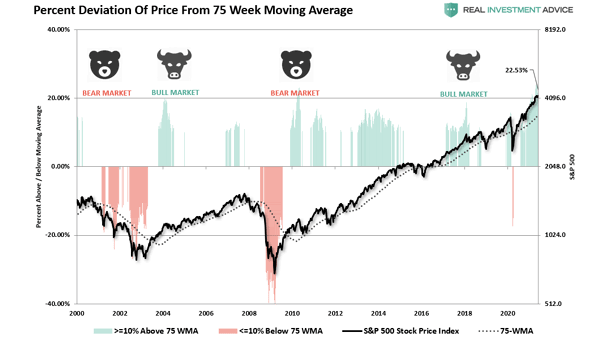
S&P 500 – Percent Deviation of Price from 75 Week Moving Average Is there a market correction on the horizon? It is highly likely that the gap between the S&P 500 Index and its 75-week…

Survey – Level on the U.S. 10-Year Treasury and a +10% Correction in Stocks Could 2.3% on the U.S. 10-year Treasury cause a +10% correction in stocks? Image: BofA Global Fund Manager Survey

U.S. 10-Year Treasury Rate and Forecasts from the Fed’s Quarterly Survey of Professional Forecasters How much trust should investors have in the Fed’s Survey of Professional Forecasters? Image: Deutsche Bank Global Research
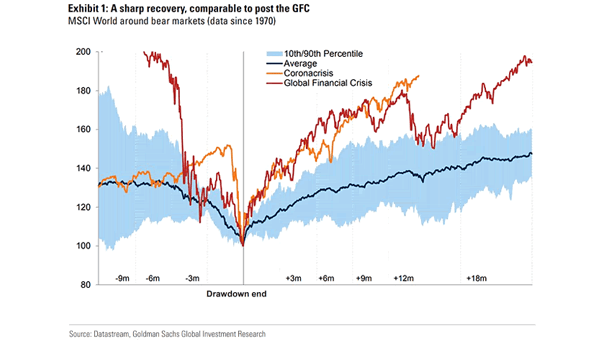
MSCI World Around Bear Markets After the shortest, and one of the sharpest bear markets in history, the MSCI World recovery is still better than post-GFC. Image: Goldman Sachs Global Investment Research