Inflation vs. S&P 500 Trailing P/E
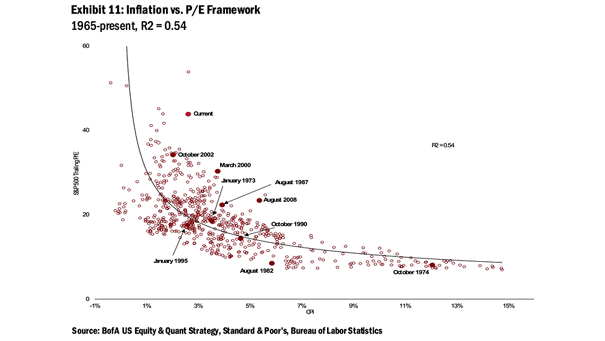
Inflation vs. S&P 500 Trailing P/E The U.S. equity market tends to see multiple compression when inflation rises (R² = 0.54). Image: BofA US Equity & Quant Strategy
Inflation vs. S&P 500 Trailing P/E The U.S. equity market tends to see multiple compression when inflation rises (R² = 0.54). Image: BofA US Equity & Quant Strategy
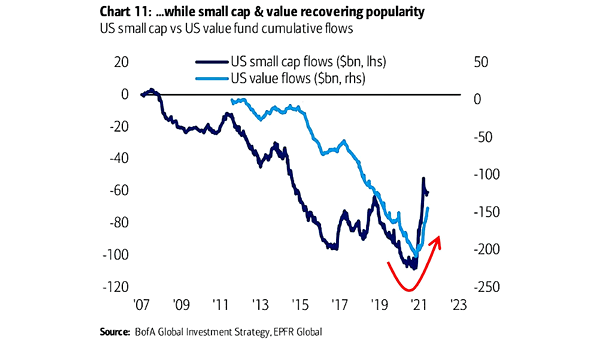
U.S. Small Cap vs. U.S. Value Fund Cumulative Flows Flows into small cap and value funds are improving amid rising inflation. Image: BofA Global Investment Strategy
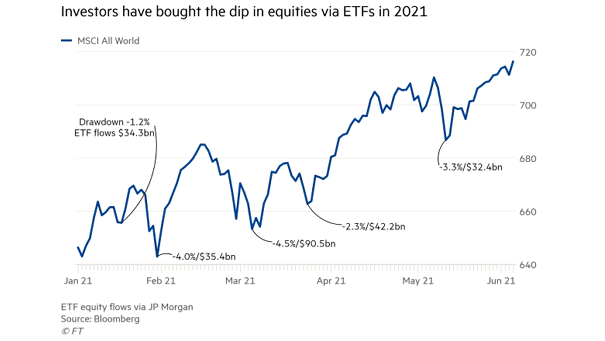
MSCI All World – ETF Equity Flows Are equities still worth buying the dip? Image: Financial Times
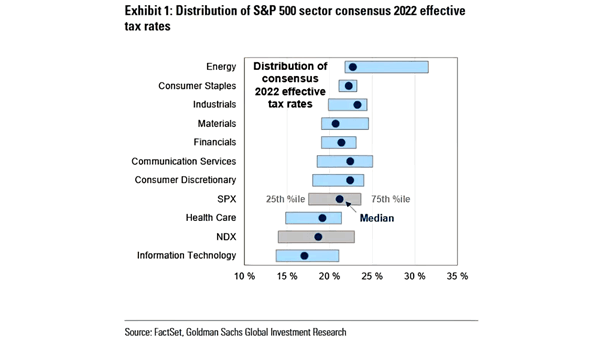
Distribution of S&P 500 Sector Consensus 2022 Effective Tax Rates Investors should not fear a global minimum corporate tax rate of 15%. Image: Goldman Sachs Global Investment Research
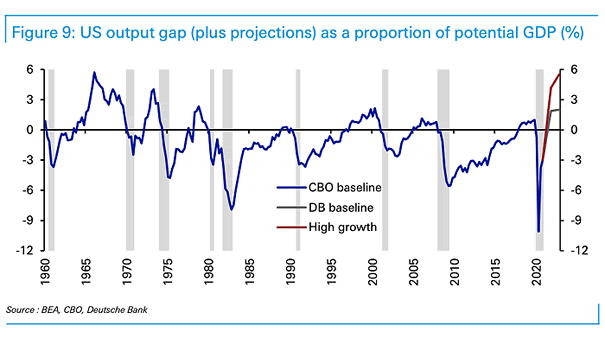
U.S. Output Gap (Plus Projections) as a Proportion of Potential GDP According to Deutsche Bank, the U.S. output gap is expected to rise above 2%, which tends to lead to higher prices. Image: Deutsche Bank
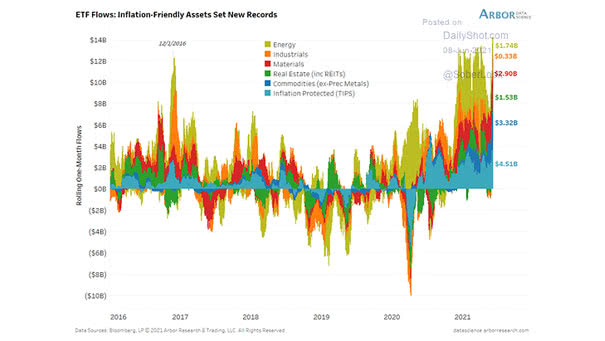
EFT Flows and Inflation-Friendly Assets Is higher inflation coming? ETF flows into inflation-friendly assets are surging. Image: Arbor Research & Trading LLC
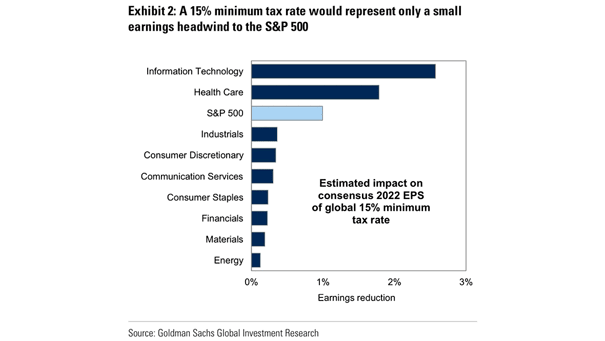
Estimated Impact on Consensus 2022 EPS of Global 15% Minimum Tax Rate Wall Street should not fear a global minimum corporate tax rate of 15%. Image: Goldman Sachs Global Investment Research
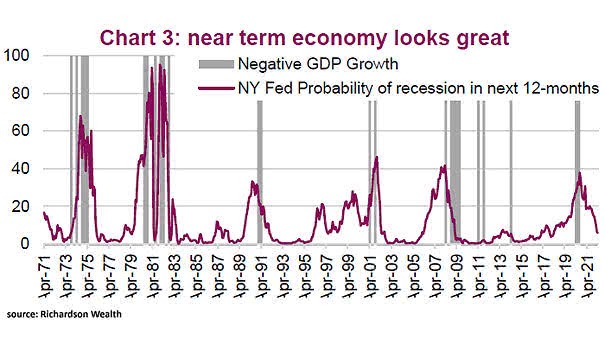
New York Fed Probability of U.S. Recession and Negative GDP Growth The likelihood of a U.S. recession in the next 12-months is very low. Image: Richardson Wealth
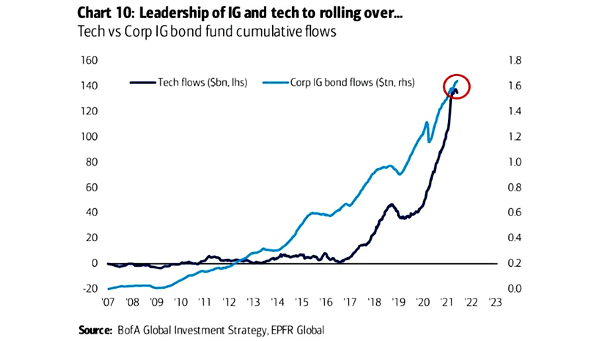
Tech vs. Corporate IG Bond Fund Cumulative Flows Should investors dump tech stocks in favor of cyclical stocks? Image: BofA Global Investment Strategy
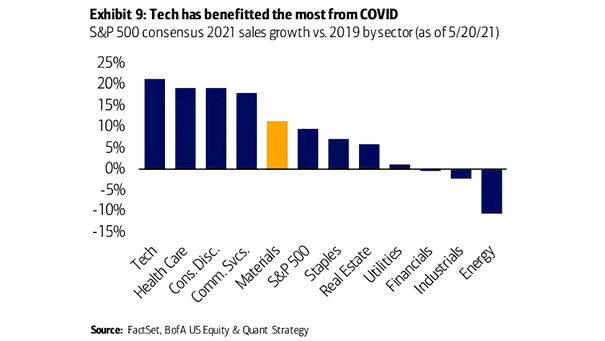
Tech – S&P 500 Consensus 2021 Sales Growth vs. 2019 by Sector Will tech benefit from a permanent shift in behavior from the pandemic? Image: BofA US Equity & Quant Strategy
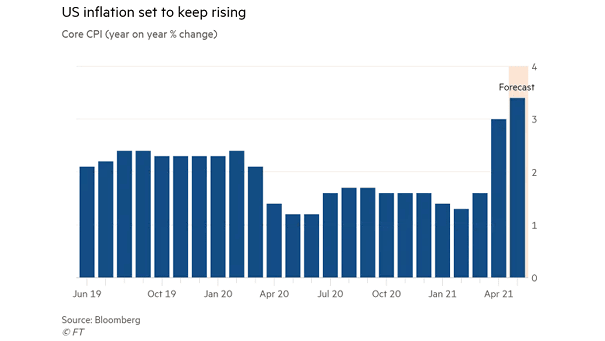
Inflation – U.S. Core CPI Forecast What impact will rising inflation have on the U.S. stock market? Image: Financial Times