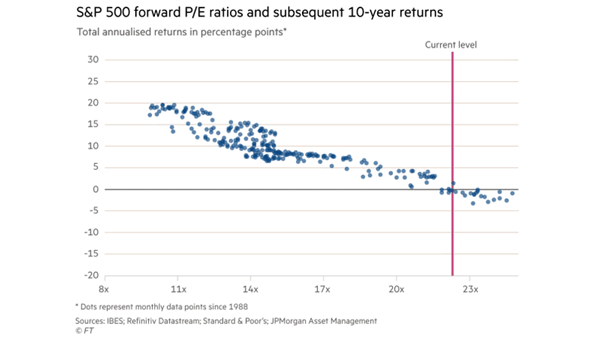
U.S. 30-Year Bond Price: Deviation from 200-Day Moving Average
U.S. 30-Year Bond Price: Deviation from 200-Day Moving Average Is it the best time to buy U.S. government bonds? Image: The Daily Shot
S&P 500 vs. Korean KOSPI Is the current divergence between the Korean KOSPI and the S&P 500 a red flag? Image: Lohman Econometrics
Cumulative Net Equity Demand Since the Start of 1999 U.S. corporates have been the biggest net buyers of stocks since the Great Financial Crisis. Image: Goldman Sachs Global Investment Research
Nasdaq 100 – QQQ Daily Fund Flows Biggest one-day inflow in two decades for QQQ, which tracks the Nasdaq 100. What already happened in 2000? Image: The Daily Shot
U.S. 2s10s Yield Curve Slope and U.S. 10-Year Rates (3-Month Implied Volatility) U.S. 10-year rates volatility is higher with stepper U.S. 2s10s yield curve. Image: Goldman Sachs Global Investment Research
Internet Search for “Bubble” Are investors starting to worry about a stock market bubble? Image: Goldman Sachs Global Investment Research
Performance – Equal Weight Tech Relative to Cap Weight Tech Will the equal-weight tech sector continue to outperform the cap-weight tech sector? Image: Strategas Research Partners
Performance – % of Active Funds Lagging Behind S&P 1500 It seems really hard to beat the market for active managers. Image: Financial Times
Largest Company in Terms of Market Value in the S&P 500 in Each Year Since 1955 When will Apple reach a $3 trillion market capitalization? Image: Goldman Sachs Global Investment Research
VIX and U.S. 10-Year Yield Despite rising interest rates, the VIX has returned to a more normal level which is a good sign for stocks. Image: Fundstrat Global Advisors, LLC
S&P 500 vs. Cumulative U.S. Equity Fund Flows U.S. equity fund inflows are very strong this year. Do retail investors buy at the top and sell at the bottom? Image: Deutsche Bank Asset Allocation