S&P 500 Breakout
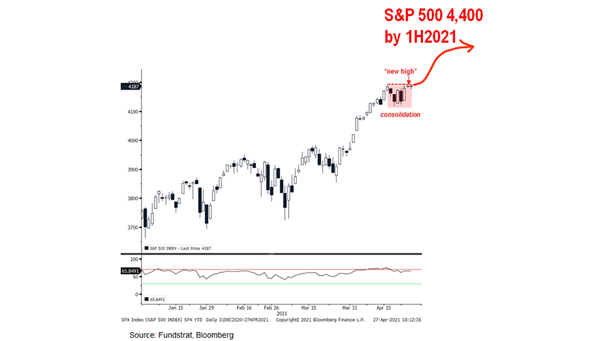
S&P 500 Breakout The breakout could be a signal for a move towards 4,400 for the S&P 500 by 1H2021. Image: Fundstrat Global Advisors, LLC
S&P 500 Breakout The breakout could be a signal for a move towards 4,400 for the S&P 500 by 1H2021. Image: Fundstrat Global Advisors, LLC
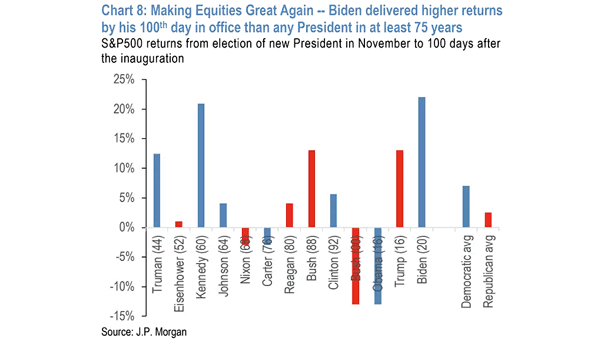
S&P 500 Returns from Election of New President in November to 100 Days After the Inauguration President Joe Biden’s 100-day stock market performance is the strongest in at least 75 years. Image: J.P. Morgan
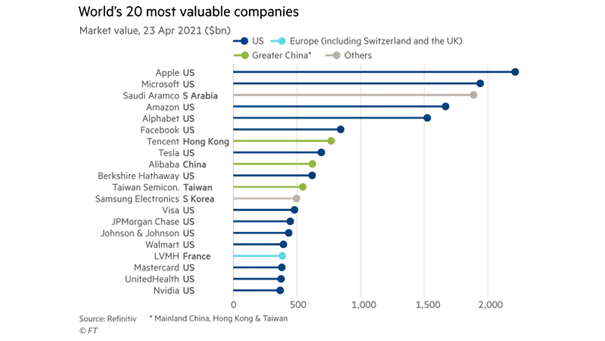
World’s 20 Most Valuable Companies – Market Value Apple remains the most valuable company in the world. Image: Financial Times
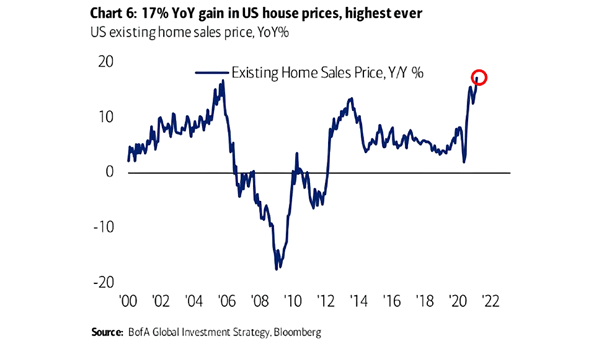
U.S. Housing – Existing Home Sales Price U.S. house prices rise much faster than wages and become too expensive for most young people. Image: BofA Global Investment Strategy
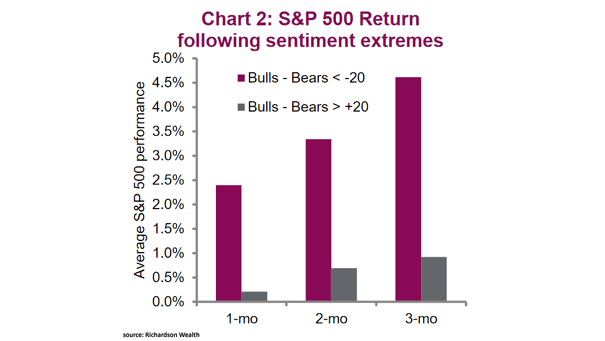
AAII Bull/Bear Survey – S&P 500 Return Following Sentiment Extremes Elevated sentiment like today suggests lower future returns. Image: Richardson Wealth
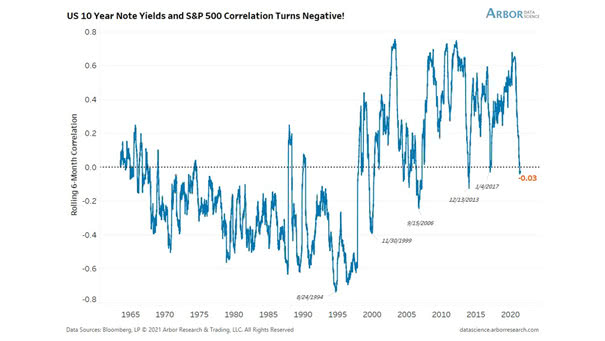
Correlation Between U.S. 10-Year Treasury Note Yields and the S&P 500 Will the negative correlation between U.S. 10-year Treasury note yields and the S&P 500 persist this time? Image: Arbor Research & Trading LLC
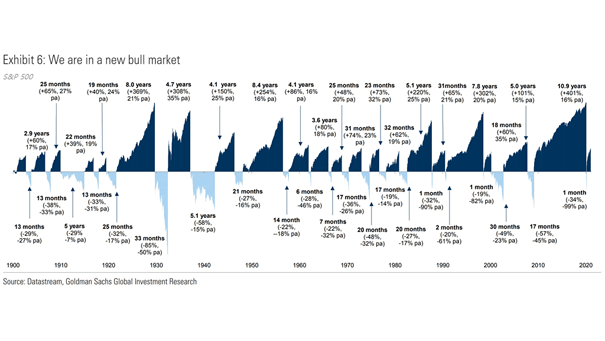
S&P 500 – History of U.S. Bull and Bear Markets Historically, bear markets tend to be shorter than bull markets. Image: Goldman Sachs Global Investment Research Click the Image to Enlarge
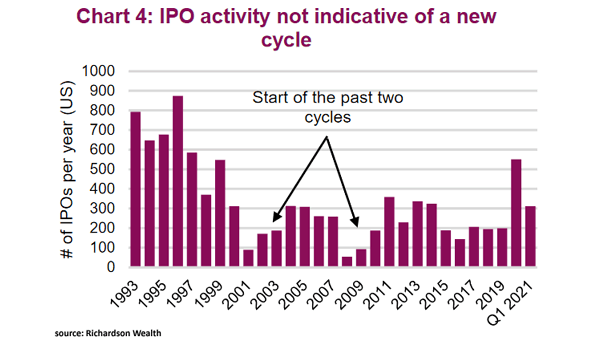
IPO Activity and Market Cycle IPO activity tends to be slow in the early phases of a new bull market, but that’s not the case today. Image: Richardson Wealth
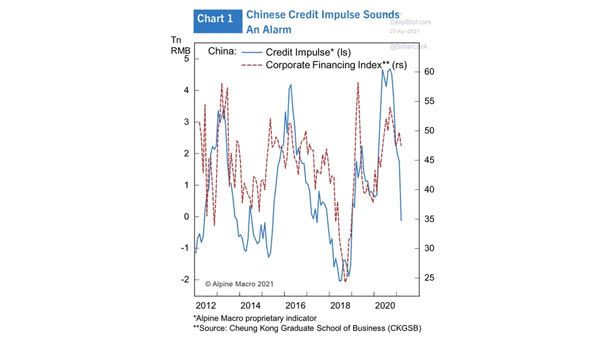
China Credit Impulse and Corporate Financing Index China credit impulse is weakening as Beijing orders banks to limit loan growth for rest of the year. Image: Alpine Macro
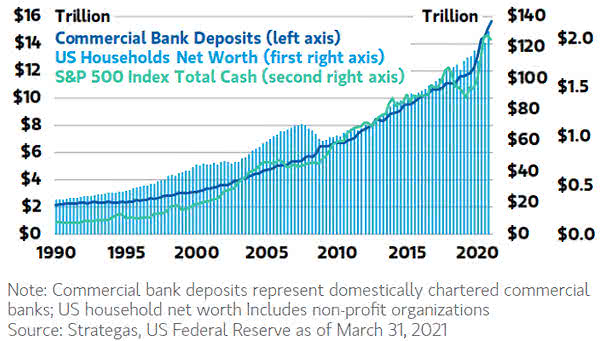
Growing Cash Balances Cash is expected to be deployed, which will stimulate capital spending, asset inflation and economic growth. Image: Morgan Stanley Wealth Management
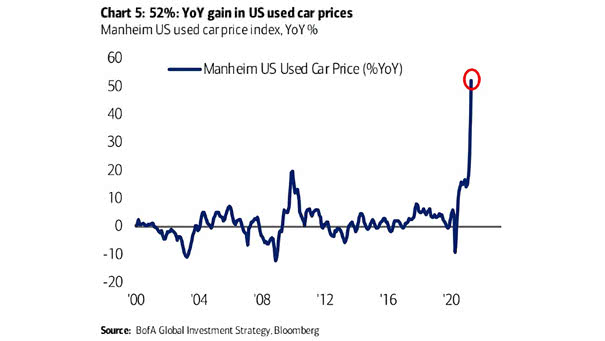
Inflation – U.S. Used Car Price It seems like a good time to sell used cars in the United States. Image: BofA Global Investment Strategy