ISM Manufacturing Index vs. S&P 500 Ratio to 12-Month Moving Average
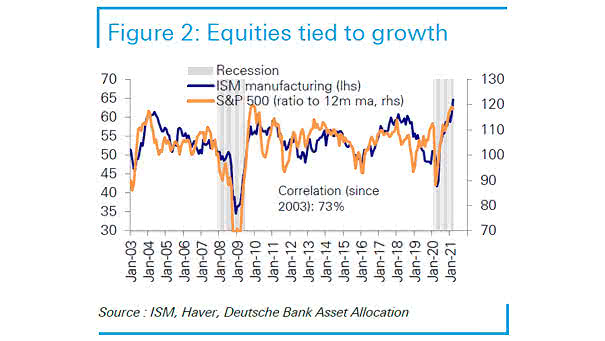
ISM Manufacturing Index vs. S&P 500 Ratio to 12-Month Moving Average Historically, the S&P 500 tends to pull back as economic growth peaks. Image: Deutsche Bank Asset Allocation
ISM Manufacturing Index vs. S&P 500 Ratio to 12-Month Moving Average Historically, the S&P 500 tends to pull back as economic growth peaks. Image: Deutsche Bank Asset Allocation
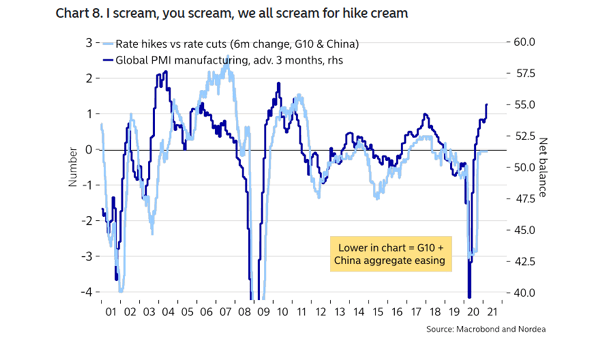
Interest Rates – Rate Hikes vs. Rate Cuts and Global PMI Manufacturing Global manufacturing PMI levels are screaming for policy tightening. Image: Nordea and Macrobond
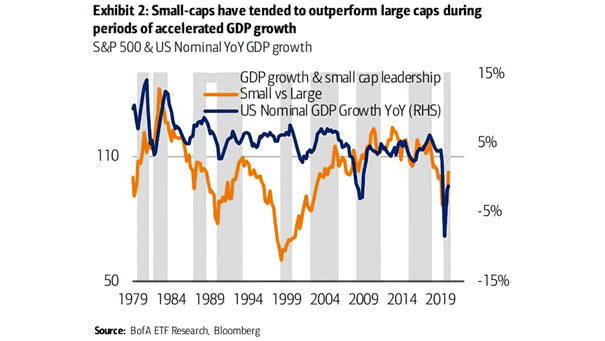
Small Cap Stocks – S&P 500 and U.S. Nominal YoY GDP Growth Historically, small-caps tend to outperform large-caps during periods of accelerated GDP growth. Image: BofA ETF Research
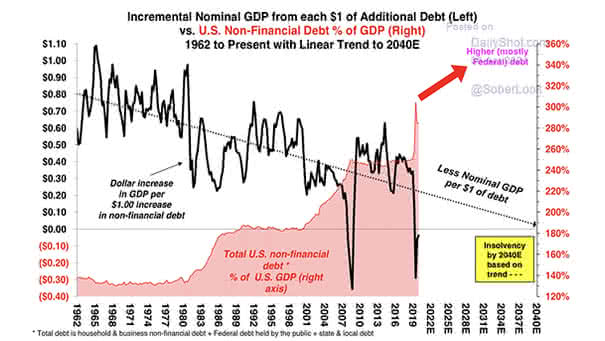
Incremental Nominal GDP from each $1 of Additional Debt vs. U.S. Non-Financial Debt % of GDP Rising U.S. debt with falling nominal GDP per $1 of incremental debt suggests insolvency by 2040. Image: Stifel
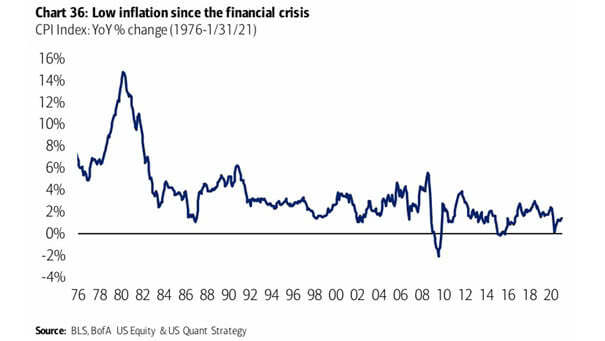
Inflation – CPI Index Since 1976 Are inflation fears overblown? Image: BofA US Equity & Quant Strategy
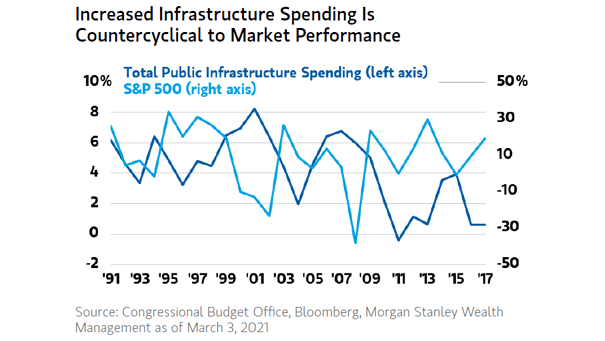
S&P 500 Performance and Total Public Infrastructure Spending Historically, increases in public infrastructure spending have been countercyclical to the performance of the S&P 500. Image: Morgan Stanley Research
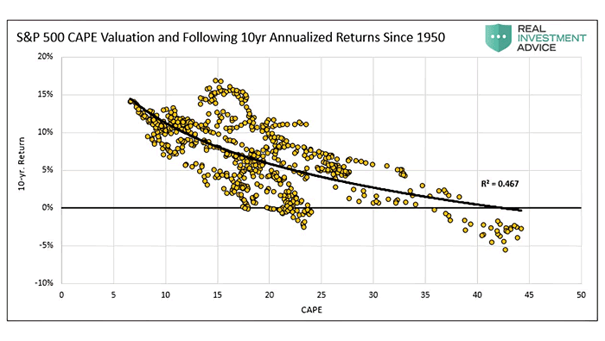
S&P 500 CAPE Valuation and Following 10-Year Annualized Returns Since 1950 Does valuation still matter in the long run? Elevated CAPE ratio suggests anemic stock market returns over the next 10 years (R² = 0.467…
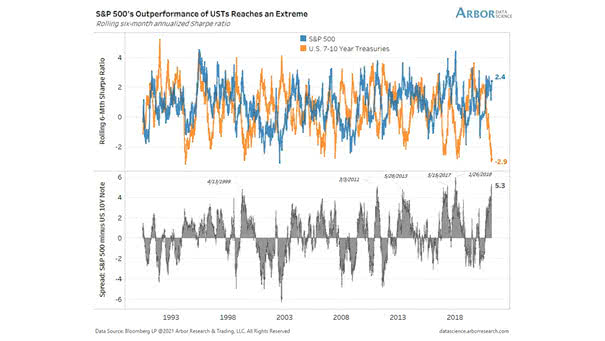
Performance – S&P 500’s Outperformance Over U.S. Treasuries Will the S&P 500’s outperformance over U.S. Treasuries continue? Image: Arbor Research & Trading LLC
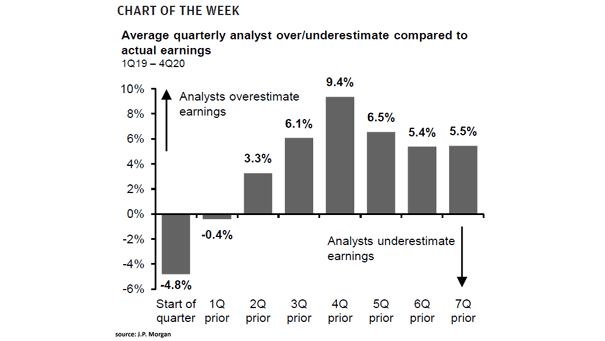
Average Quarterly Analyst Over/Underestimate Compared to Actual Earnings Financial analysts play a role in market efficiency, but they tend to overestimate earnings until one quarter out. Image: J.P. Morgan Asset Management
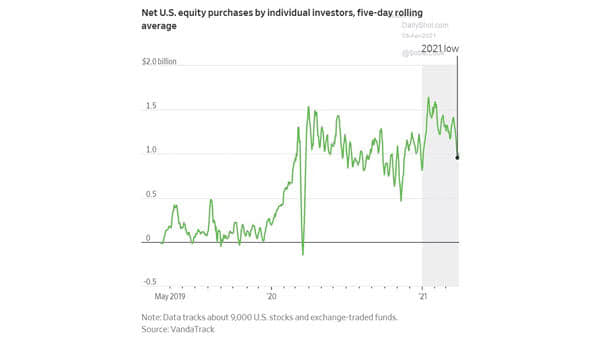
Net U.S. Equity Purchases by Individual Investors Are individual investors going into hibernation? Image: The Wall Street Journal
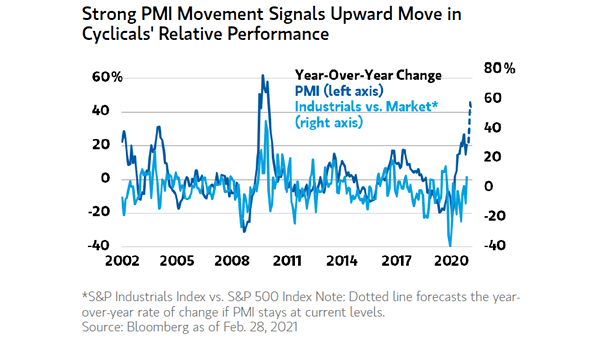
Cyclical Stocks – PMI YoY Change and Industrials vs. Market Will cyclical stocks lead markets higher as the economy recovers? Image: Morgan Stanley Wealth Management