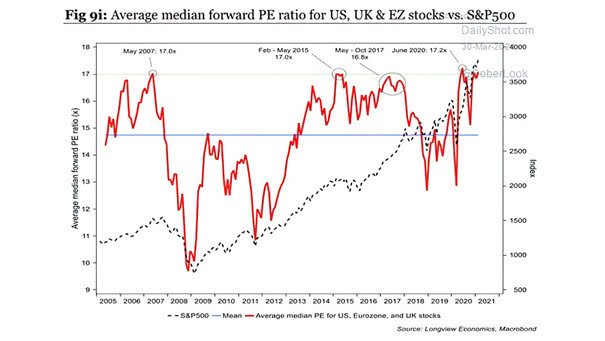
Russell 2000 Index – Members Above 200-Day Moving Average
Russell 2000 Index – Members Above 200-Day Moving Average Are investors too optimistic, as small-cap breadth is reaching overbought levels? Image: Morgan Stanley Wealth Management
Large-Cap Mutual Funds – Over/(Under)weight Allocations Large-cap mutual funds are underweight retail favorites. Image: Goldman Sachs Global Investment Research
S&P 500 Index and Non-Profitable Tech Stocks Despite the lack of profit, non-profitable tech stocks continue to rise. Are they in a bubble? Image: The Daily Shot
BAA Corporate Yield (Inverted) vs. S&P 500 Can stocks keep rising or should investors expect a market correction? Image: BCA Research
Market Capitalization and Trading Volumes in Extremely High-Valuation U.S. Stocks Trading volumes in extremely high-valuation U.S. stocks have surged since 2020. Image: Goldman Sachs Global Investment Research
Returns – Frequency of Monthly Gains in S&P 500 When Yields Rise and Decline Should equity investors be worried about rising interest rates? Image: Financial Times
Major Economies Central Banks Total Assets and MSCI ACWI Central bank balance sheet expansion is expected to push equities higher. Image: BofA Global Research
EUR/USD and Relative Growth Expectations (EMU vs. U.S.) Will the current EUR/USD trend eventually reverse, as the U.S. is expected to outperform Europe? Image: Nordea and Macrobond
G4 Central Banks’ Balance Sheets – Projection The G4 central banks’ balance sheet is expected to reach $29.6 trillion by year-end 2022. Image: Morgan Stanley Research
Tech Fund Flows (6-Week Cumulative) Record inflows to tech past 6 weeks, as investors expect the tech sector to continue to outperform. Image: BofA Global Investment Strategy
Valuation – the Ratio of S&P 500 Market Capitalization vs. M2 Money Supply What’s priced in? Currently, the S&P 500 trades well above the post-crisis valuation vs. M2 money supply. Image: BofA US Equity &…