Annualized Performance of Various Asset Classes During the 1970s
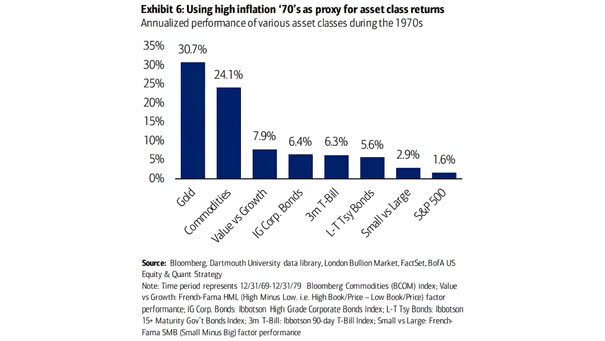
Annualized Performance of Various Asset Classes During the 1970s Gold and commodities tend to do well during periods of high inflation. Image: BofA Global Research
Annualized Performance of Various Asset Classes During the 1970s Gold and commodities tend to do well during periods of high inflation. Image: BofA Global Research
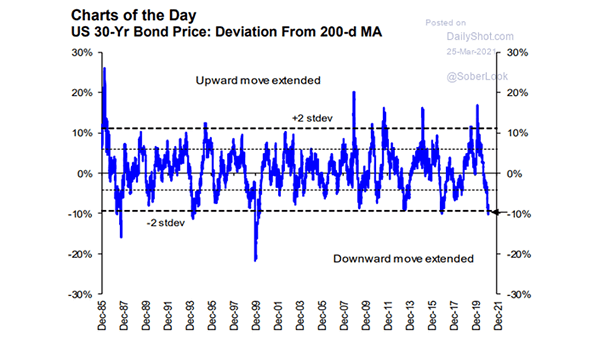
U.S. 30-Year Bond Price: Deviation from 200-Day Moving Average Is it the best time to buy U.S. government bonds? Image: The Daily Shot
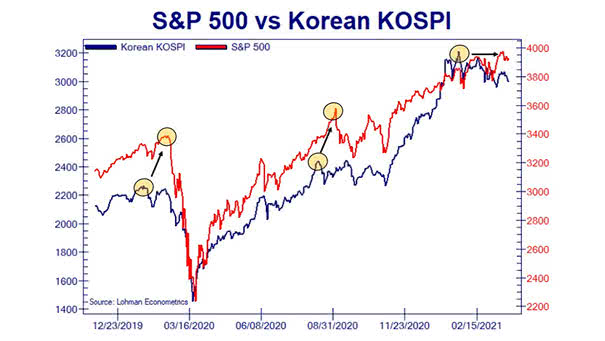
S&P 500 vs. Korean KOSPI Is the current divergence between the Korean KOSPI and the S&P 500 a red flag? Image: Lohman Econometrics
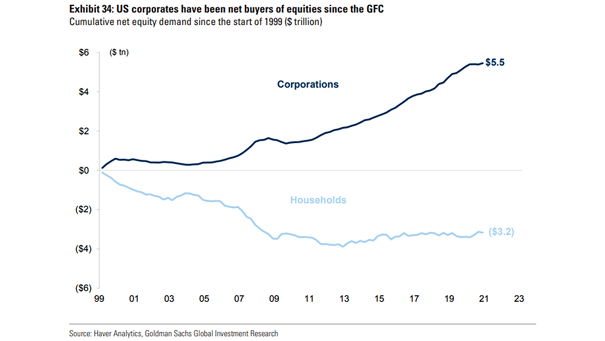
Cumulative Net Equity Demand Since the Start of 1999 U.S. corporates have been the biggest net buyers of stocks since the Great Financial Crisis. Image: Goldman Sachs Global Investment Research
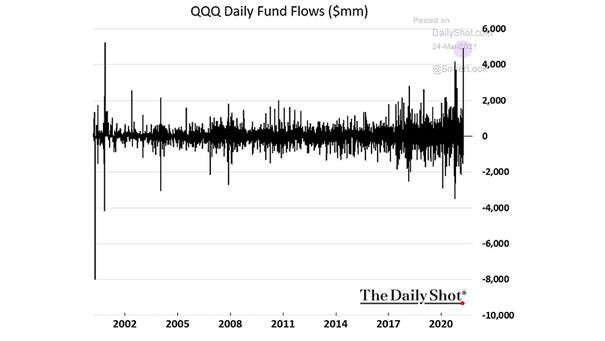
Nasdaq 100 – QQQ Daily Fund Flows Biggest one-day inflow in two decades for QQQ, which tracks the Nasdaq 100. What already happened in 2000? Image: The Daily Shot
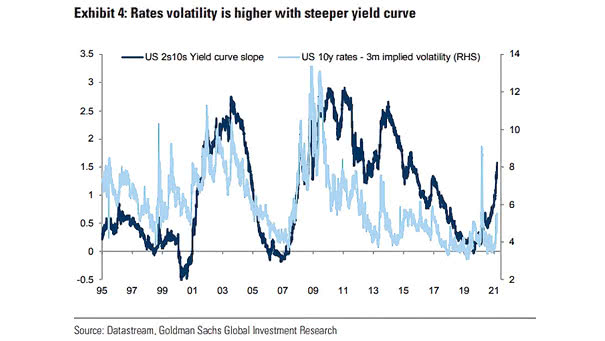
U.S. 2s10s Yield Curve Slope and U.S. 10-Year Rates (3-Month Implied Volatility) U.S. 10-year rates volatility is higher with stepper U.S. 2s10s yield curve. Image: Goldman Sachs Global Investment Research
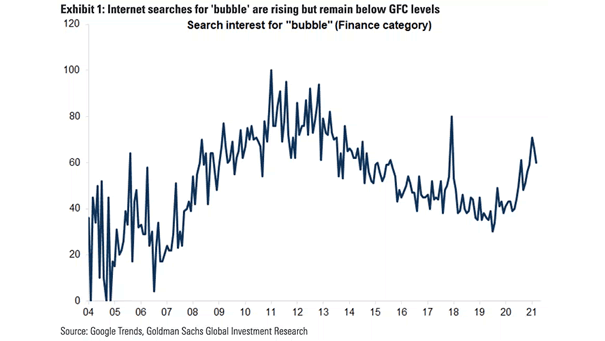
Internet Search for “Bubble” Are investors starting to worry about a stock market bubble? Image: Goldman Sachs Global Investment Research
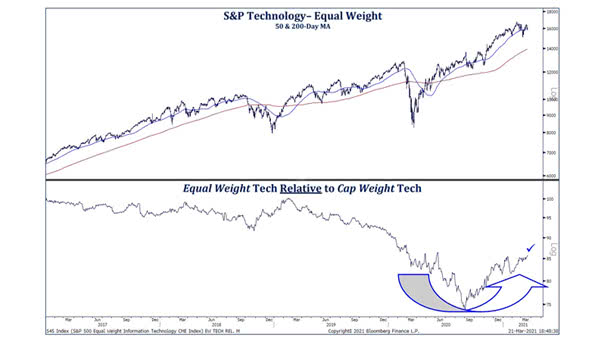
Performance – Equal Weight Tech Relative to Cap Weight Tech Will the equal-weight tech sector continue to outperform the cap-weight tech sector? Image: Strategas Research Partners
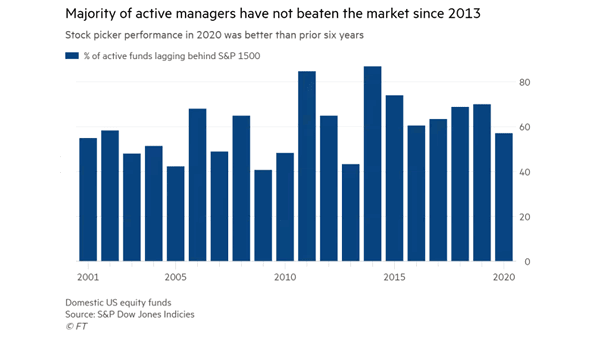
Performance – % of Active Funds Lagging Behind S&P 1500 It seems really hard to beat the market for active managers. Image: Financial Times
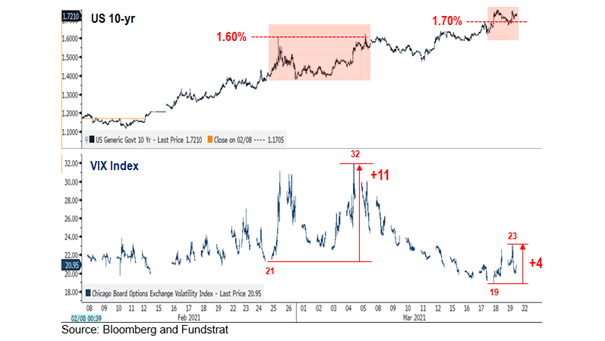
VIX and U.S. 10-Year Yield Despite rising interest rates, the VIX has returned to a more normal level which is a good sign for stocks. Image: Fundstrat Global Advisors, LLC
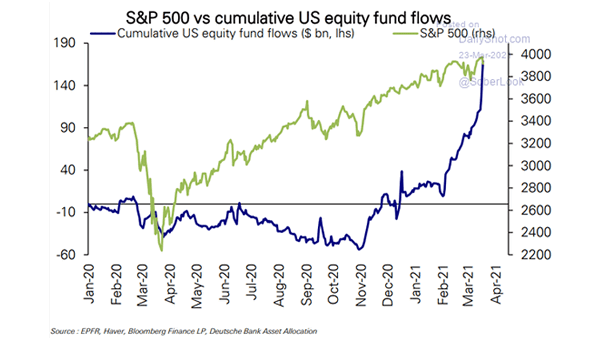
S&P 500 vs. Cumulative U.S. Equity Fund Flows U.S. equity fund inflows are very strong this year. Do retail investors buy at the top and sell at the bottom? Image: Deutsche Bank Asset Allocation