Cumulative Equity Fund Flows
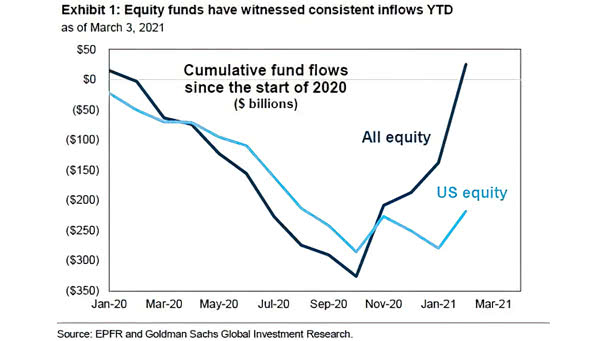
Cumulative Equity Fund Flows Global equity fund inflows are very strong in recent months. Image: Goldman Sachs Global Investment Research
Cumulative Equity Fund Flows Global equity fund inflows are very strong in recent months. Image: Goldman Sachs Global Investment Research
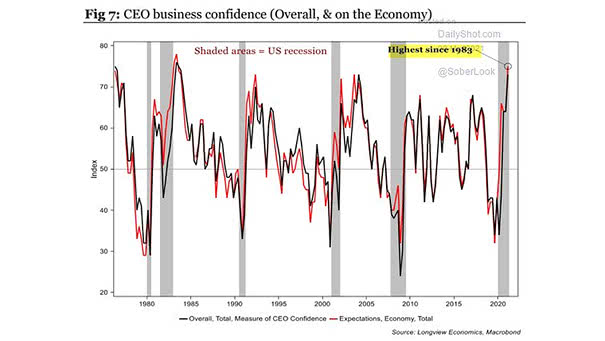
CEO Business Confidence CEOs are very confident in future business conditions in the United States. Image: Longview Economics
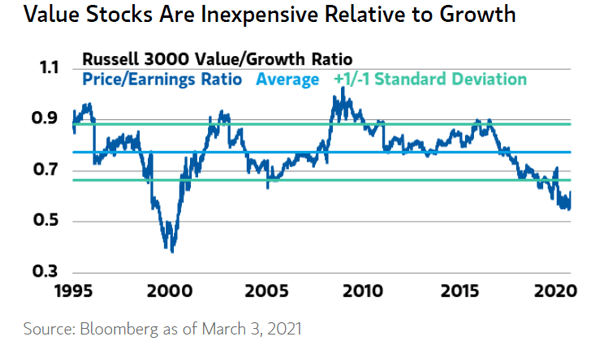
Russell 3000 Value/Growth Ratio – Price/Earnings Ratio Value stocks remain cheap relative to growth stocks, despite the recent strength in value stocks. Image: Morgan Stanley Wealth Management
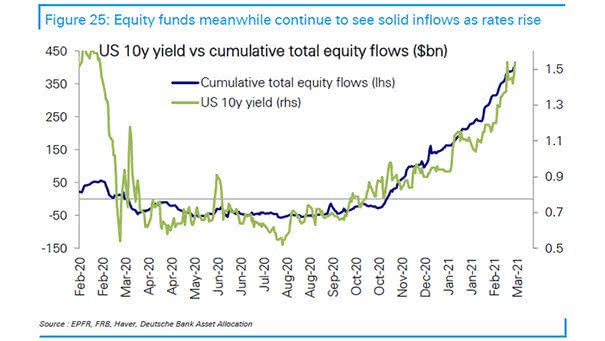
U.S. 10-Year Yield vs. Cumulative Total Equity Flows Equity funds tend to experience net inflows as rates rise. Image: Deutsche Bank Asset Allocation
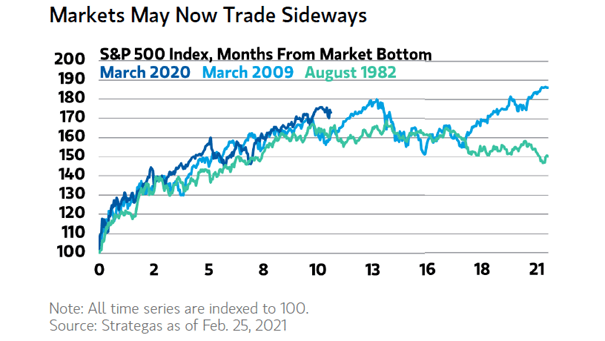
S&P 500 Index – Months from Market Bottom Should investors expect the S&P 500 to trade sideways? Image: Morgan Stanley Wealth Management
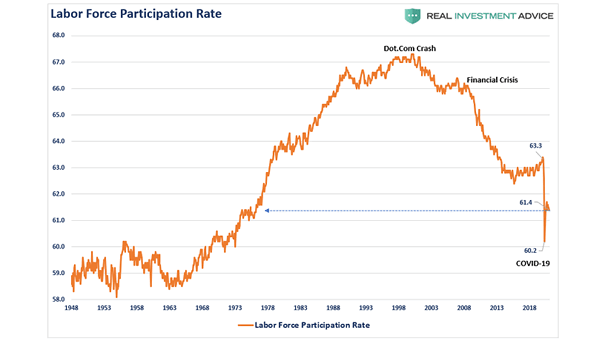
U.S. Labor Force Participation Rate The U.S. labor force participation rate is low amid the coronavirus pandemic and could be a serious obstacle to the economic recovery. Image: Real Investment Advice
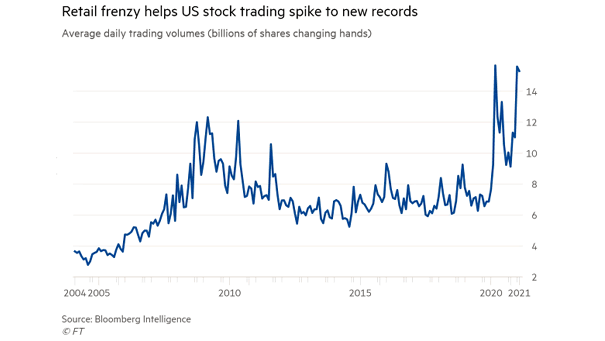
Stock Market – Average Daily Trading Volumes Stock trading volumes surge, as the frenzy of trading attracts many retail investors to the stock market. Image: Financial Times
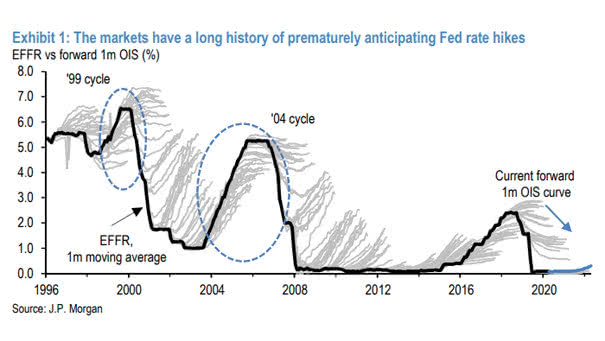
Interest Rates – Fed Rate Hikes Is the market overpricing odds of Fed rate hike? Image: J.P. Morgan
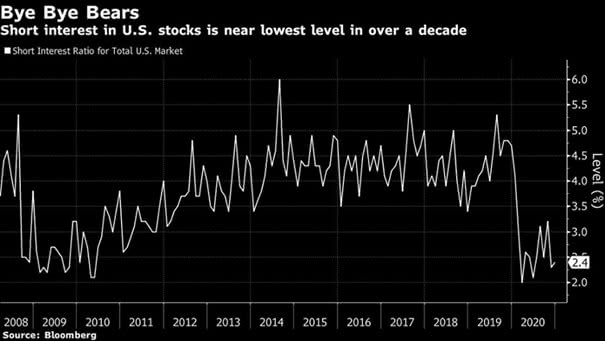
U.S. Stocks – Short Interest Ratio for Total U.S. Market Short interest in U.S. stocks remains very low. Image: Bloomberg
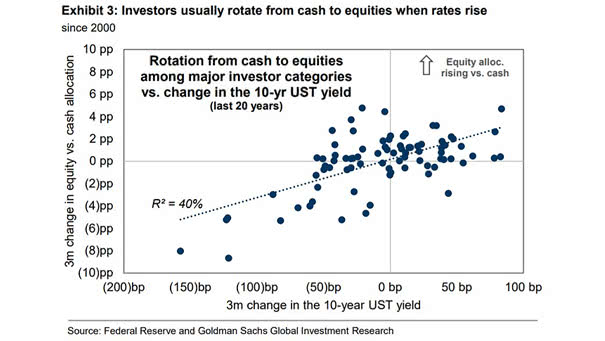
Rotation from Cash to Equities Among Major Investor Categories vs. Change in the U.S. 10-Year Treasury Yield Historically, investors tend to rotate from cash to equities when rates rise. Image: Goldman Sachs Global Investment Research
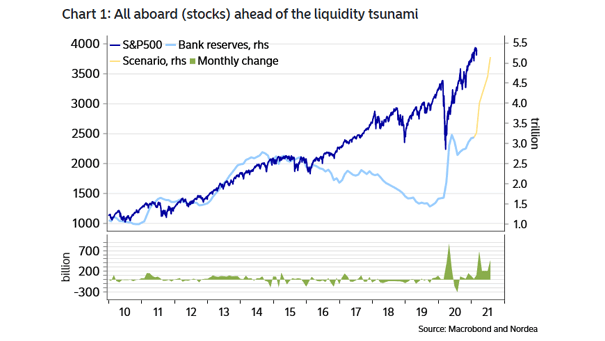
S&P 500 and Bank Reserves U.S. excess liquidity is expected to rise significantly and tends to push equities higher. Image: Nordea and Macrobond