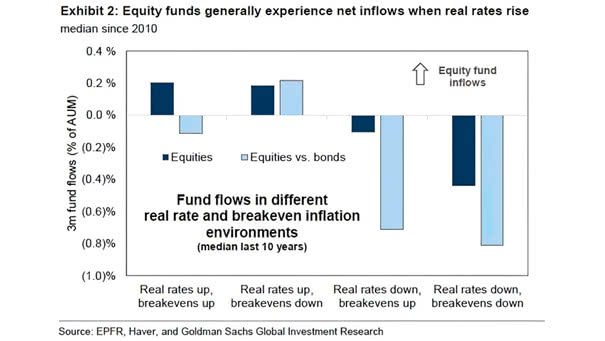
U.S. M1 Money Supply Growth vs. Steepness of U.S. Yield Curve
U.S. M1 Money Supply Growth vs. Steepness of U.S. Yield Curve The U.S. yield curve is expected to steepen as M1 money supply growth goes to the moon. Image: Longview Economics
U.S. Total Call Option Volumes for Stocks and Indices U.S. total call option volume for stocks and indices is continuing to soar. Will this end well? Image: Deutsche Bank
CTAs Exposure to Equities CTAs overall equity exposure is in the 42th percentile. Image: Deutsche Bank Asset Allocation
Non-Profitable U.S. Tech Companies The stock prices of non-profitable U.S. tech companies are at record highs. Should investors be worried? Image: Morgan Stanley Wealth Management
12-Month Moving Correlation of U.S. 10-Year Bond Yields to U.S. Stocks in USD The correlation between U.S. stocks and bond yields should soon become negative. Image: BCA Research
Hedge Funds and Systematic Investor Positioning Hedge funds and systematic investor positioning is low in a long-term historical context. Is any market pullback a buying opportunity? Image: J.P. Morgan Quantitative and Deratives Strategy
Momentum Signals for Bitcoin Is the Bitcoin fever starting to break? Image: J.P. Morgan
U.S. Stock Market’s Daily Volume U.S. stock trading volumes surge, as retail investors face down hedge funds. Image: Financial Times
Equity Risk Premium – MSCI Emerging Markets Index The EM equity risk premium is high, suggesting plenty of room for further gains. Image: Morgan Stanley Wealth Management
Sentiment – 25-Day U.S. Put/Call Ratio Bearish seasonality risk is increasing, as the 25-day put/call ratio is trading at relatively low levels. Image: BofA
S&P 500 Deflated by CPI and Trend Is the S&P 500 in a bubble disconnected from reality? Image: BCA Research