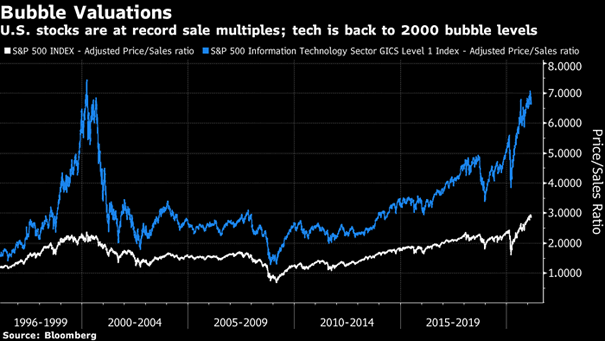
S&P 500 and % of Stocks Above 200-Day Moving Average

S&P 500 and % of Stocks Above 200-Day Moving Average When more than 90% of stocks are above their 200-day moving average, the S&P 500 tends to be positive over a 12-month period. Image: Strategas…

Performance – U.S. Renewables Stocks and S&P 500

Performance – U.S. Renewables Stocks and S&P 500 U.S. renewables stocks have outperformed the S&P 500 by a large margin during the past 12 months. Image: Goldman Sachs Global Investment Research

S&P 500 Today and S&P 500 in 2009

S&P 500 Today and S&P 500 in 2009 Is a correction coming? The S&P 500 is tracking the 2009 recovery analog, so far. Image: Morgan Stanley Research

Hedge Fund Leverage

Hedge Fund Leverage Hedge fund net leverage is close to record levels. It is also high compared to the average level of the last ten years. Image: Morgan Stanley

S&P 500 Monthly Seasonality

S&P 500 Monthly Seasonality Historically, February isn’t usually a great month. Image: BofA Global Research

45 Years of Asset Bubbles

45 Years of Asset Bubbles The parabolic move of Bitcoin in a short period of time has pushed it into bubble territory. Image: Deutsche Bank