U.S. 30-Year Bond Total Return by Year Since 1974
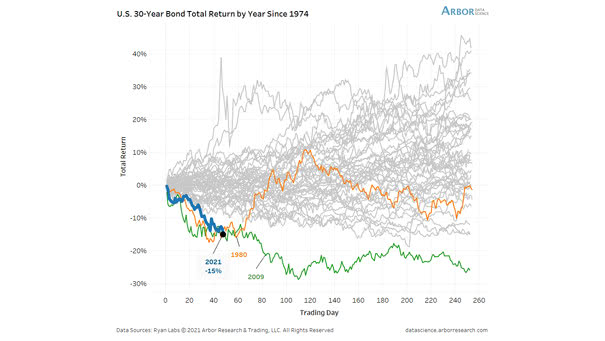
U.S. 30-Year Bond Total Return by Year Since 1974 Will 30-year bond yields keep rising? Image: Arbor Research & Trading LLC
U.S. 30-Year Bond Total Return by Year Since 1974 Will 30-year bond yields keep rising? Image: Arbor Research & Trading LLC
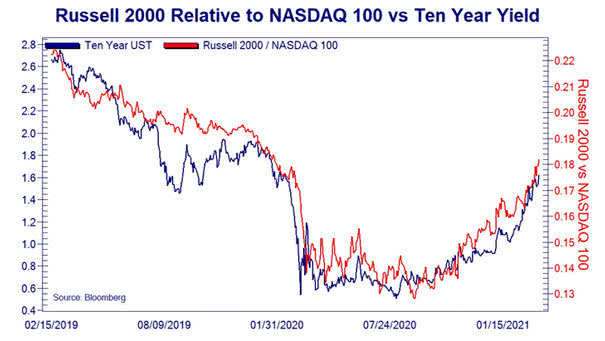
Performance – Russell 2000 Relative to Nasdaq 100 vs. U.S. 10-Year Treasury Yield Will small-cap stocks continue to outperform large-cap growth stocks, if the U.S. 10-year Treasury yield continues to rise? Image: Lohman Econometrics
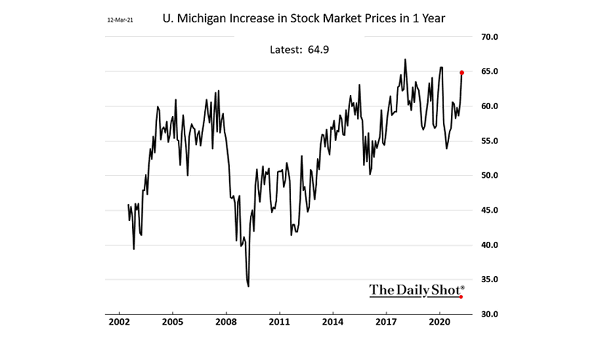
Sentiment – U. Michigan Increase in Stock Market Prices in 1-Year U.S. consumers are very bulish for stock prices in 1-year. Image: The Daily Shot
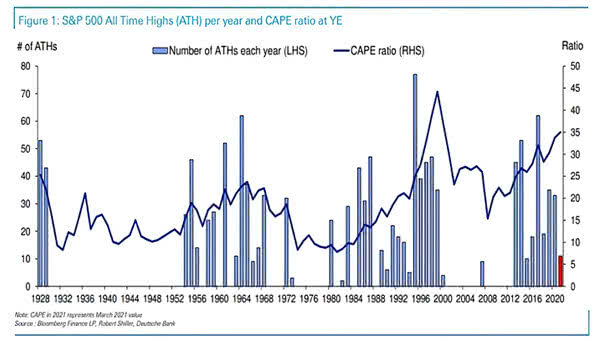
S&P 500 All Time Highs per Year and CAPE Ratio at YE Yesterday was the 11th all-time high in 2021. New all-time highs tend to occur in clusters and can last more than 10 years.…
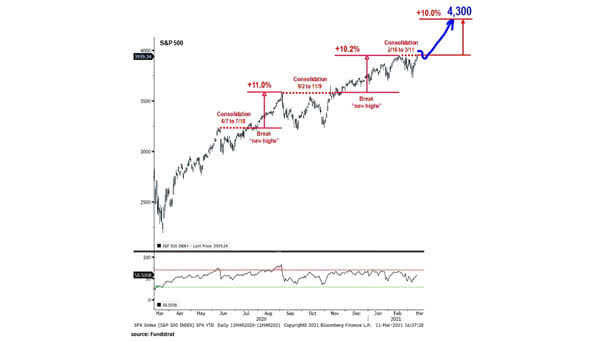
S&P 500 Index Forecast Will the S&P 500 rise 10% to 4,300 by the end of June 2021? Image: Fundstrat Global Advisors, LLC
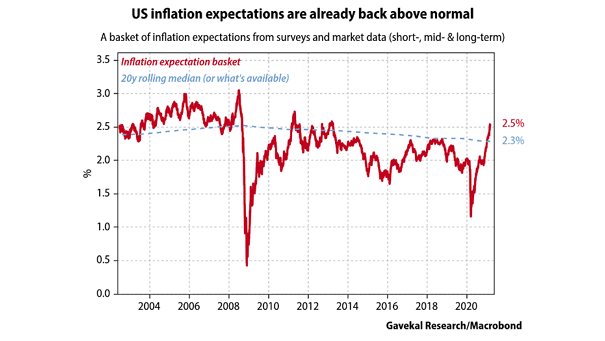
U.S. Inflation Expectation Basket Will U.S. inflation expectations fall back to lower levels? Image: Gavekal, Macrobond
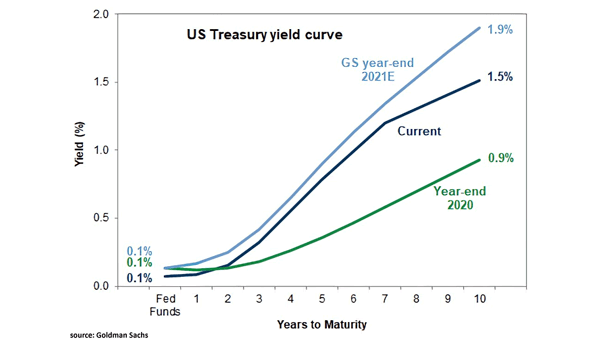
U.S. Treasury Yield Curve Goldman Sachs expects the U.S. Treasury yield curve to steepen further in 2021. Image: Goldman Sachs Global Investment Research
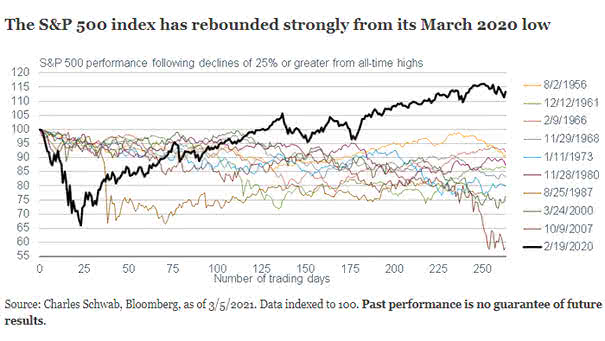
S&P 500 Performance Following Declines of 25% of Greater from All-Time Highs Since March 2020, the U.S. stock market’s recovery has been astonishing. Image: Charles Schwab
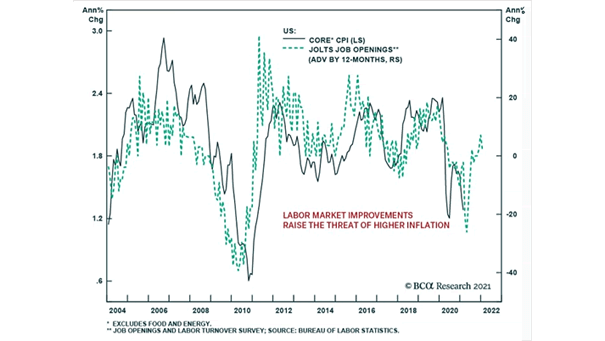
U.S. Core CPI and JOLTS Job Openings (Leading Indicator) JOLTS Job Openings tend to lead U.S. core CPI by 12 months. Image: BCA Research
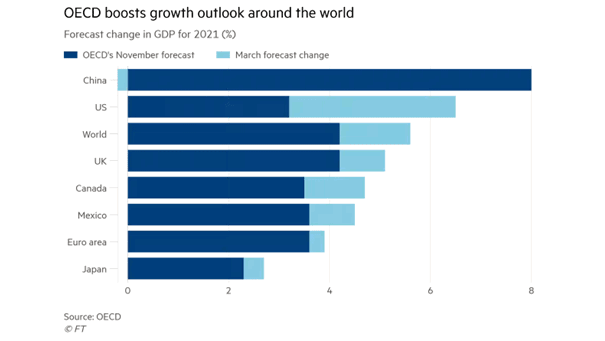
Forecast Change in GDP for 2021 OECD raises world GDP growth forecast to 5.6% for 2021. Image: Financial Times
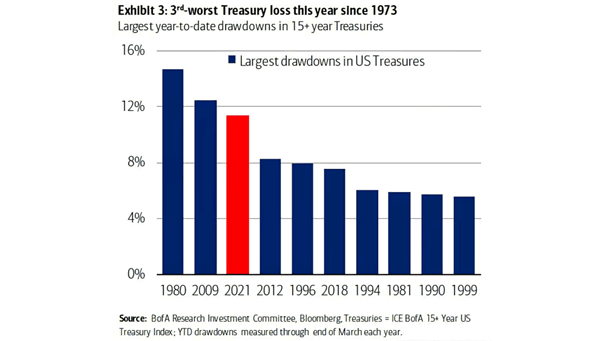
Largest Drawdowns in U.S. Treasuries Will U.S. Treasuries continue to suffer? Image: BofA Research Investment Committee