Weekly Global Equity Flows
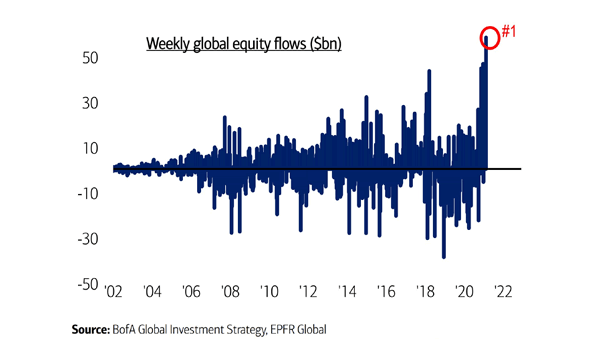
Weekly Global Equity Flows Global equity inflows remain very strong. Image: BofA Global Investment Strategy
Weekly Global Equity Flows Global equity inflows remain very strong. Image: BofA Global Investment Strategy
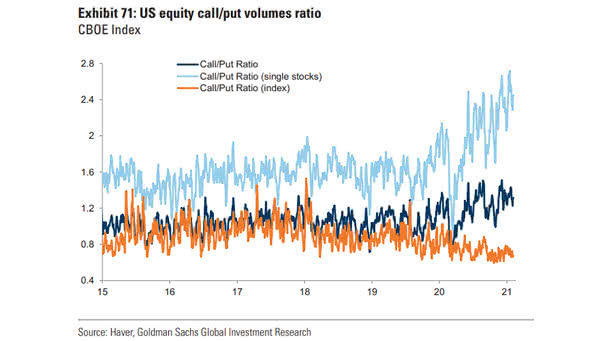
U.S. Equity Call/Put Volumes Ratio The call/put ratio remains high and could limit the market’s upside potential. Image: Goldman Sachs Global Investment Research
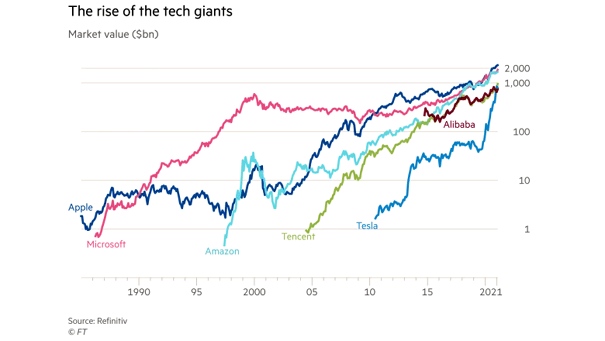
The Rise of the Tech Giants – Market Value In terms of returns to shareholders, Jeff Bezos (Amazon) is behind Elon Musk (Tesla) and Bill Gates (Microsoft) since flotation or during the CEO’s tenure. Image:…
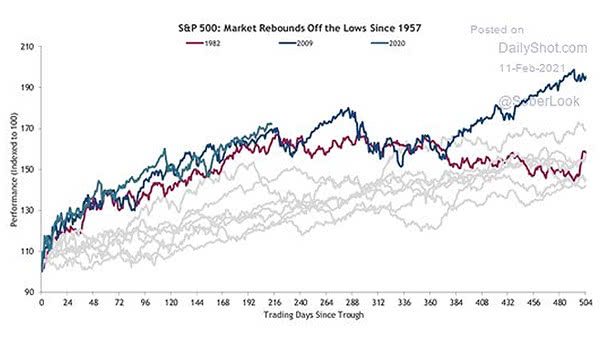
S&P 500 – Market Rebounds Off the Lows Since 1957 The stock market rebound since the low shows that usually selling into a panic doesn’t pay off. Image: Truist
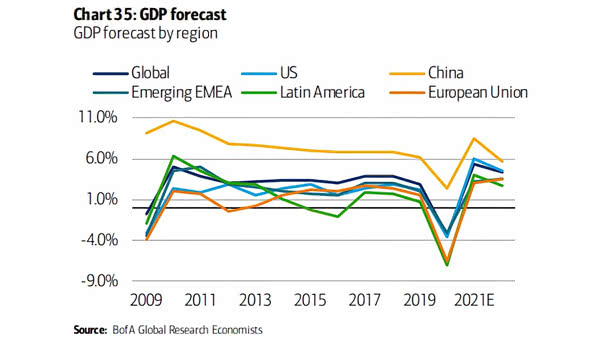
GDP Forecast by Region Thanks to the vaccine rollout, will the U.S. economy expand more rapidly than expected in 2021? Image: BofA Global Research Economists
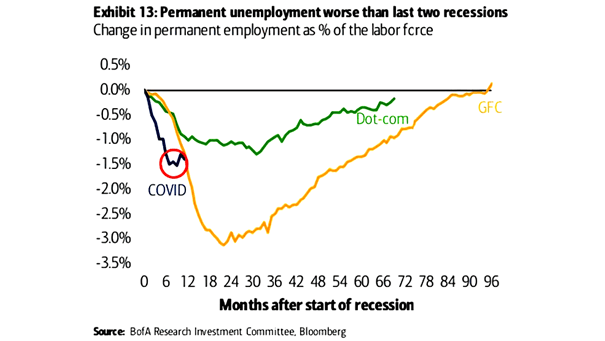
Change in Permanent Employment as % of the Labor Force Permanent unemployment is worse than the last two recessions. Image: BofA Research Investment Committee
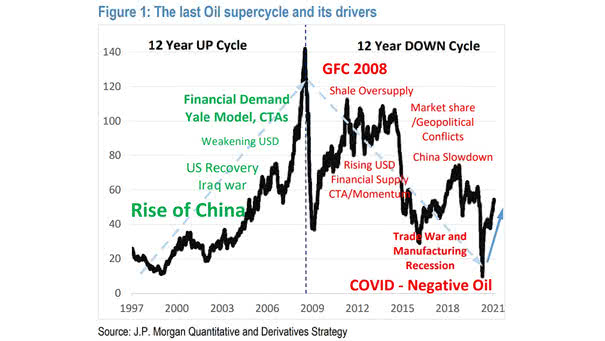
The Last Oil Supercycle and Its Drivers Should investors expect the start of a new supercycle in oil? Image: J.P. Morgan Quantitative and Derivative Strategy
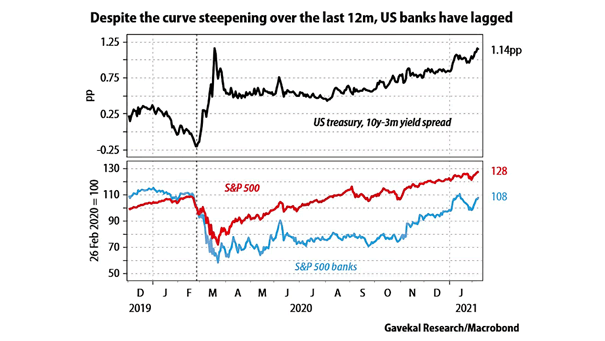
Performance – S&P 500 Banks vs. 10Y-3M U.S. Treasury Yield Curve U.S. banks have lagged the broad market over the last 12 months, despite the yield curve steepening. Image: Gavekal, Macrobond
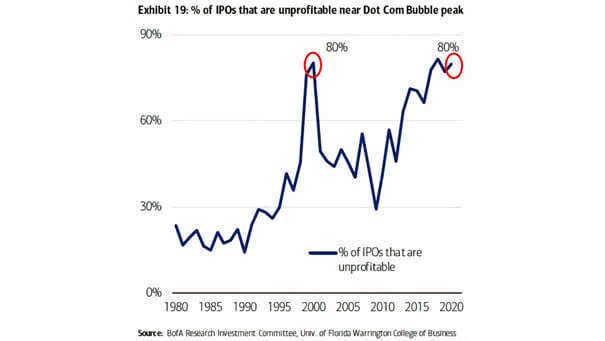
% of IPO that Are Unprofitable More and more unprofitable companies are going public. Image: BofA Research Investment Committee
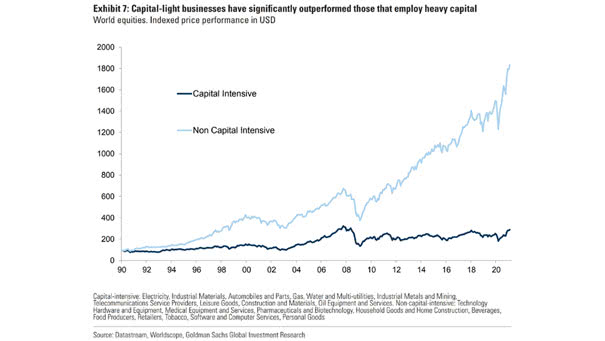
World Equities Performance – Capital Intensive Companies vs. Non Capital Intensive Companies Equity markets tend to penalize capital-intensive companies. Image: Goldman Sachs Global Investment Research
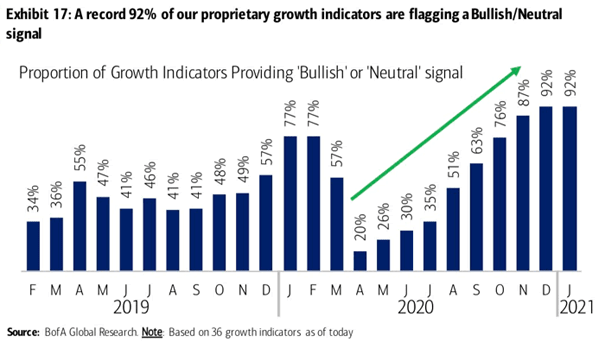
Proportion of Growth Indicators Providing Bullish or Neutral Signal Markets are pricing in perfection, as 92% of BofA proprietary indicators are flashing bullish or neutral signals. Image: BofA Global Research