Value vs. Growth and Small Caps vs. Large Caps
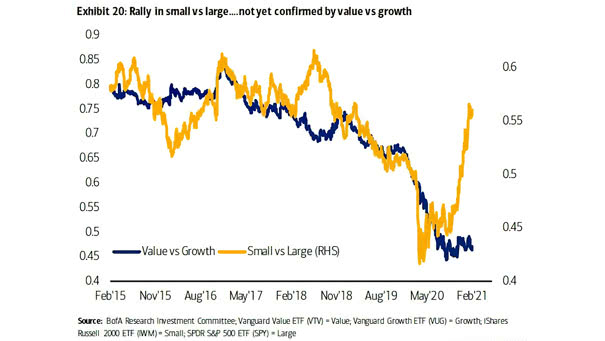
Value vs. Growth and Small Caps vs. Large Caps The rally in small caps is a strong bullish signal, but it has not yet been confirmed by a rebound in value vs. growth. Image: BofA…
Value vs. Growth and Small Caps vs. Large Caps The rally in small caps is a strong bullish signal, but it has not yet been confirmed by a rebound in value vs. growth. Image: BofA…
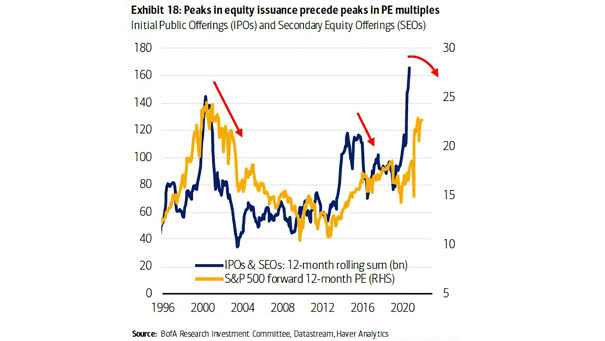
Initial Public Offerings (IPOs) and Secondary Equity Offerings (SEOs) and S&P 500 Fwd 12-Month P/E – Leading Indicator Peaks in equity market issuance tend to precede peaks in S&P 500 P/E multiples. Image: BofA Research…
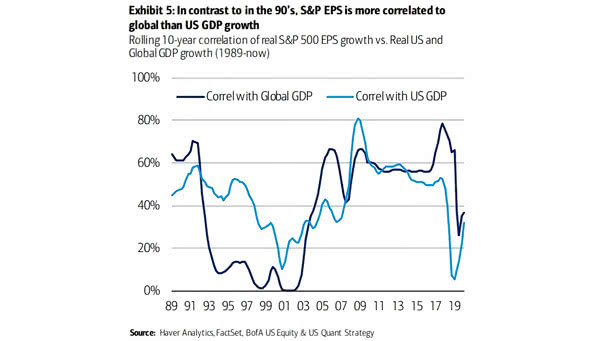
Rolling 10-Year Correlation of Real S&P 500 EPS Growth vs. Real U.S. and Global GDP Growth Real S&P 500 EPS growth tends to be more correlated to global than U.S. GDP growth. Image: BofA US…
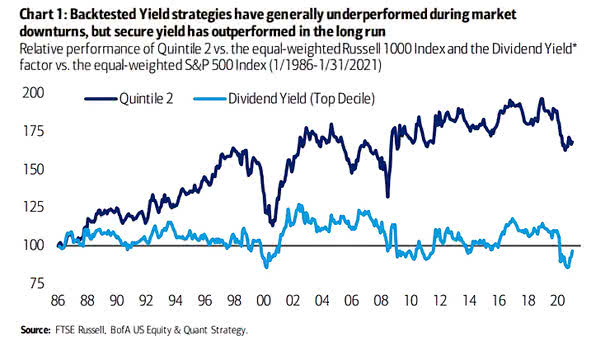
Performance – Dividend Yield Secure yield tends to outperform in the long run. Image: BofA US Equity & Quant Strategy
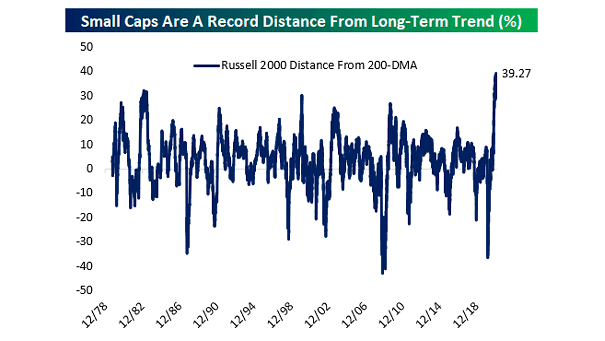
Small Caps – Russell 2000 Distance from 200-Day Moving Average Is there is too much optimism built into small-caps? Image: Bespoke Investment Group
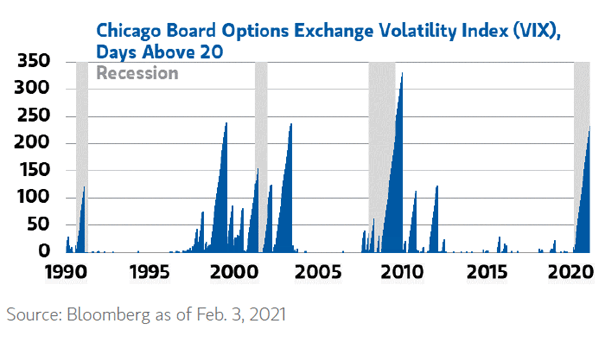
Volatility – VIX and Days Above 20 A prolonged VIX above 20 is typical of recessions. Patience is usually the key to successful investing. Image: Morgan Stanley Wealth Management
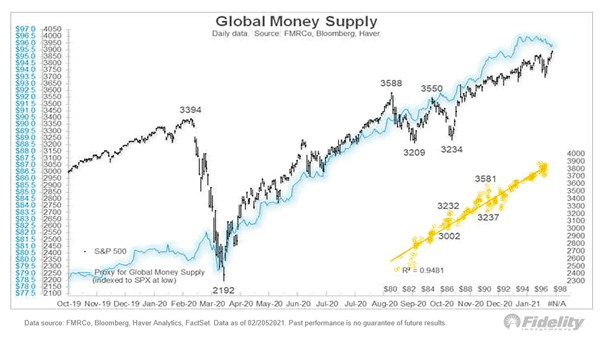
S&P 500 vs. Global Money Supply More global stimulus could be bullish for stocks, as global money supply growth tends to push U.S. equities higher. Image: Fidelity Investments
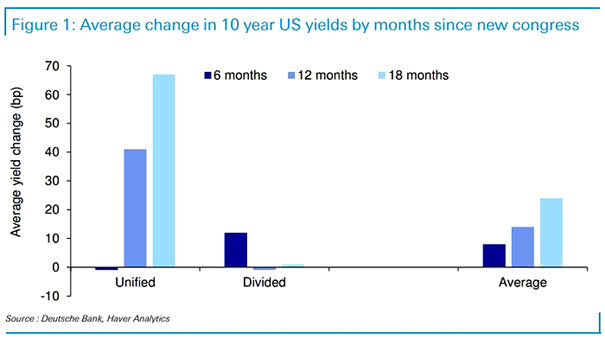
Average Change in 10-Year U.S. Yields by Months Since New Congress A unified government tends to lead to higher yields. Image: Deutsche Bank
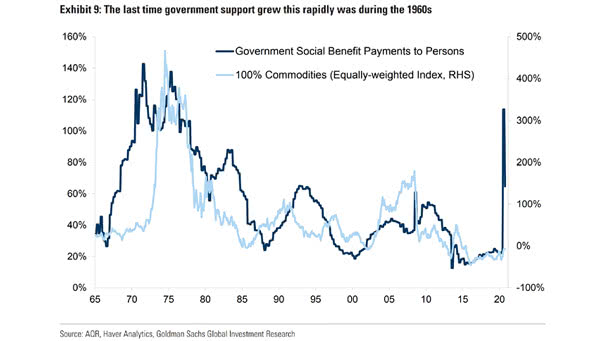
Government Social Benefit Payments to Persons and 100% Commodities (Equally-Weighted Index) Should investors expect the start of a new supercycle in commodities? Image: Goldman Sachs Global Investment Research
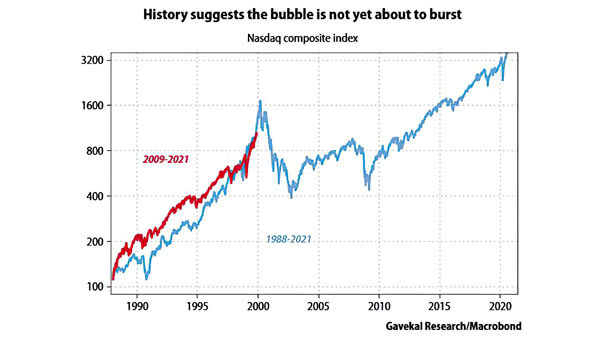
Nasdaq Composite Index – 2009-2021 vs. 1988-2021 History suggests the tech bubble is not yet expected to pop. Image: Gavekal, Macrobond
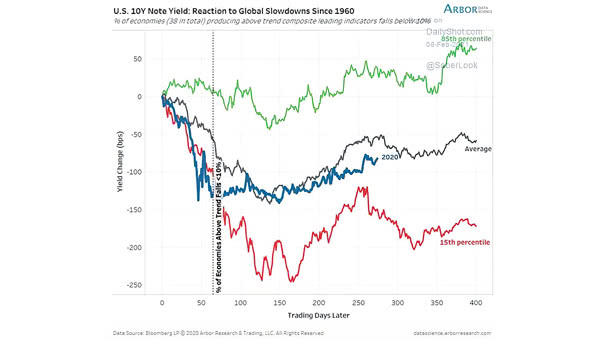
U.S. 10-Year Note Yield – Reaction to Global Slowdowns Since 1960 Global slowdowns do not occur often. The U.S. 10-year Treasury note yield is currently following the average historical trend. Image: Arbor Research & Trading…