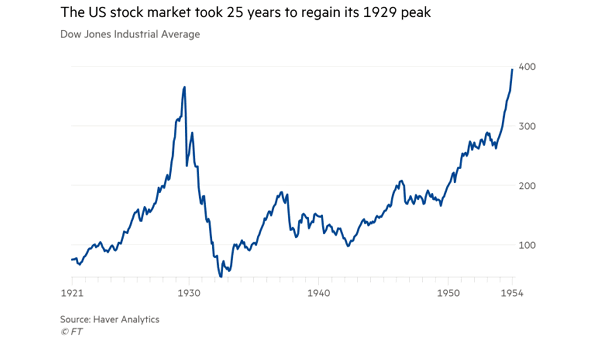
Valuation – Dow Jones Industrial Average from 1921 to 1954
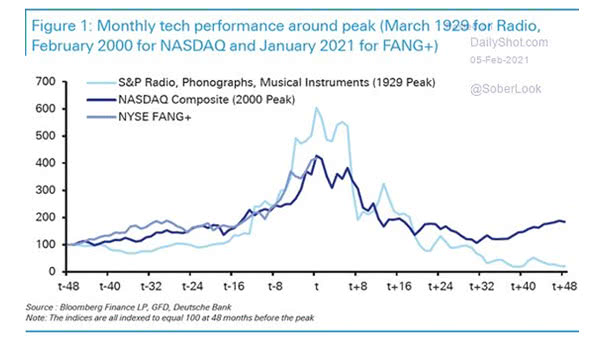
Valuation – Dow Jones Industrial Average from 1921 to 1954 It took the Dow Jones 25 years to regain its 1929 highs. Is the U.S. stock market currently in bubble territory? Image: Financial Times