S&P 500 Growth Index and Percent of IPOs with Negative EPS
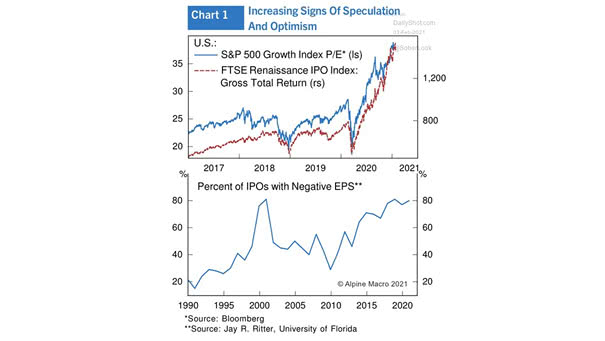
S&P 500 Growth Index and Percent of IPOs with Negative EPS Growing signs of speculation and optimism, as more unprofitable companies are going public. Image: Alpine Macro
S&P 500 Growth Index and Percent of IPOs with Negative EPS Growing signs of speculation and optimism, as more unprofitable companies are going public. Image: Alpine Macro
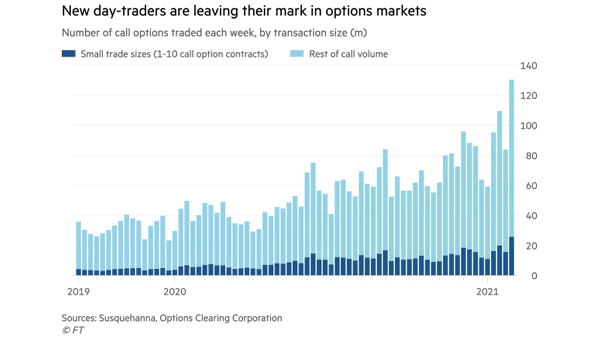
Number of Call Options Traded Each Week Call option volume is continuing to soar. Does it suggest a future market meltdown? Image: Financial Times
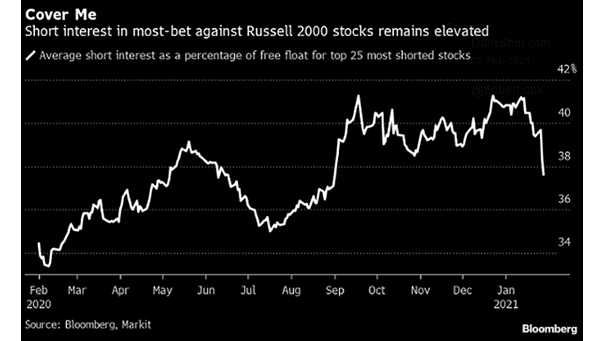
Average Short Interest as a Percentage of Free Float for Top 25 Most Shorted Stocks Short-interest in most-bet against Russell 2000 stocks is declining, but remains high. Is more volatility coming? Image: Bloomberg
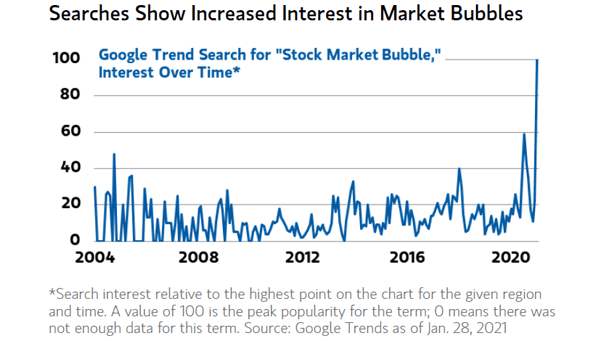
Trend Search for “Stock Market Bubble,” Interest Over Time Is a storm coming as searches for “Stock Market Bubble” reached an all-time high in January? Image: Morgan Stanley Wealth Management
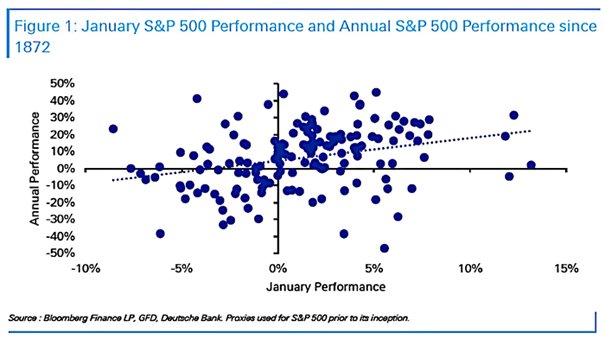
January S&P 500 Performance and Annual S&P 500 Performance Since 1872 Could the negative January for the S&P 500 be a warning sign for the rest of 2021? Image: Deutsche Bank
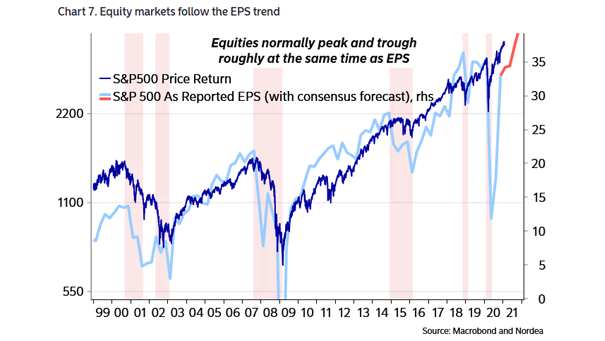
S&P 500 Price Return and S&P 500 as Reported EPS Equity markets tend to follow the EPS trend. Image: Nordea and Macrobond
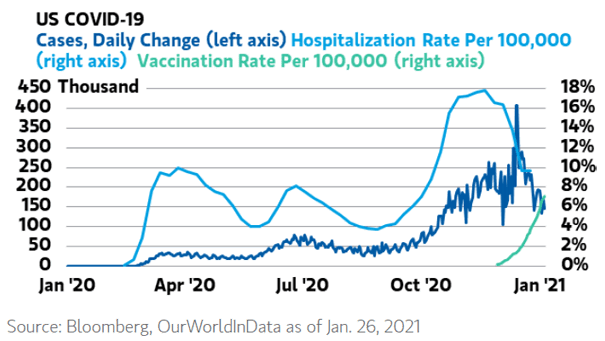
Coronavirus – U.S. COVID-19 Cases, Hospitalization Rate and Vaccination Rate U.S. COVID-19 data is encouraging, as new daily infections and hospitalizations are declining. Image: Morgan Stanley Wealth Management
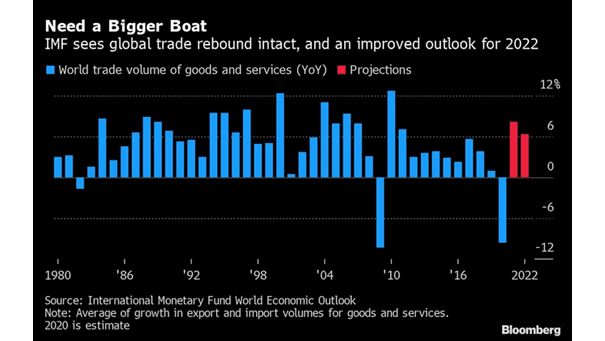
World Trade Volume of Goods and Services The International Monetary Fund expects global trade to rebound in 2021 and 2022. Image: Bloomberg
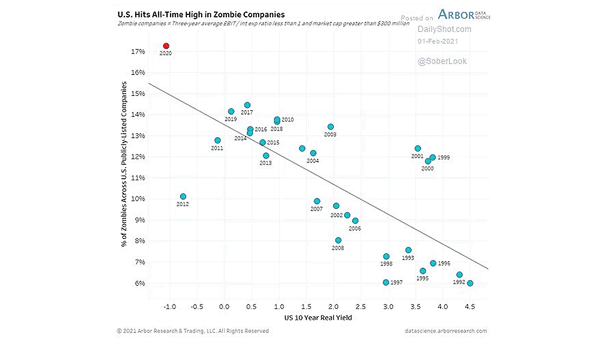
U.S. Zombie Companies and U.S. 10-Year Real Yields Chart showing that the percentage of zombie companies continues to rise as U.S. 10-year real yields fall. Image: Arbor Research & Trading LLC
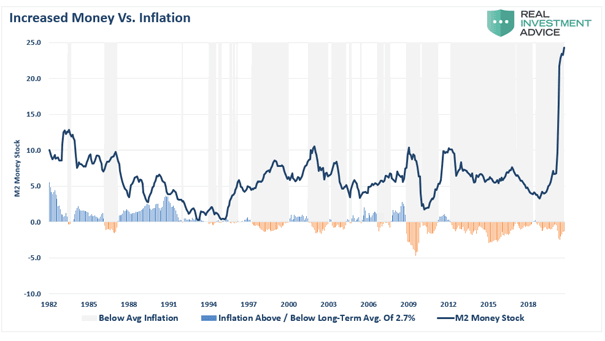
M2 Money Supply and Inflation The link between money supply and inflation seems to have collapsed. Image: Real Investment Advice
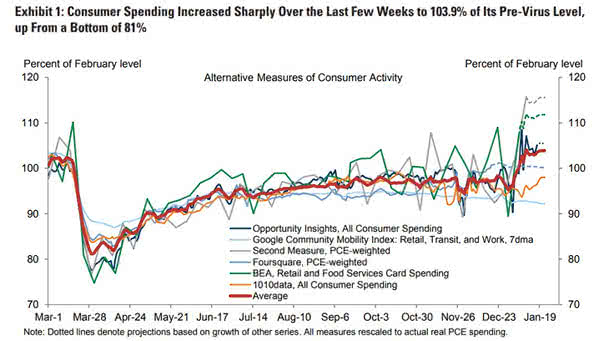
Alternative Measures of U.S. Consumer Activity U.S. consumer spending increased sharply over the last few weeks and is now above its pre-coronavirus level. Image: Goldman Sachs Global Investment Research