S&P 500 Number of Daily Drawdowns Greater Than 3%
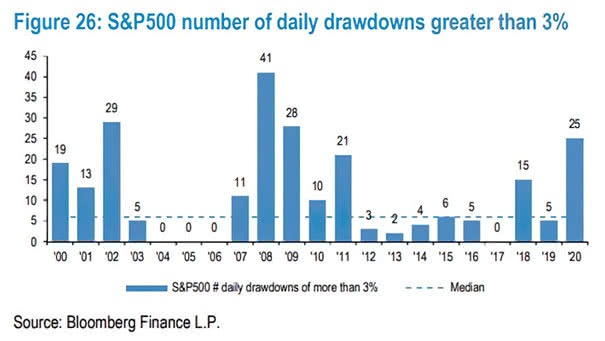
S&P 500 Number of Daily Drawdowns Greater Than 3% Last year, the S&P 500 had a very high number of daily drawdowns greater than 3%. Image: J.P. Morgan
S&P 500 Number of Daily Drawdowns Greater Than 3% Last year, the S&P 500 had a very high number of daily drawdowns greater than 3%. Image: J.P. Morgan
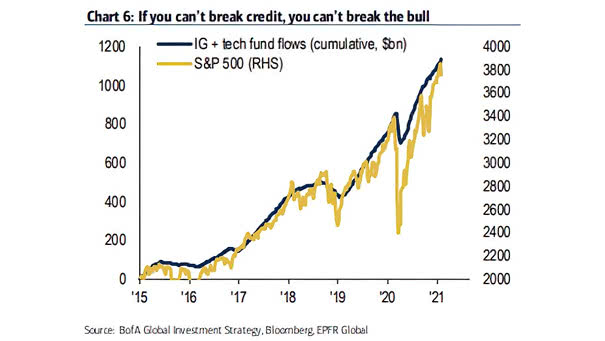
Bull Market – IG + Tech Fund Flows and S&P 500 What will end the current bull market? Image: BofA Global Investment Strategy
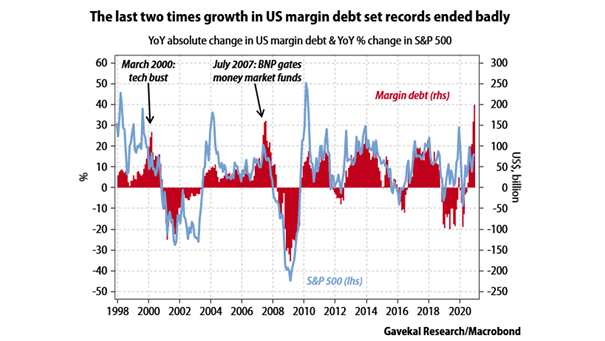
YoY Absolute Change in U.S. Margin Debt and YoY % Change in S&P 500 Should investors be worried about the growth of margin debt? Image: Gavekal, Macrobond
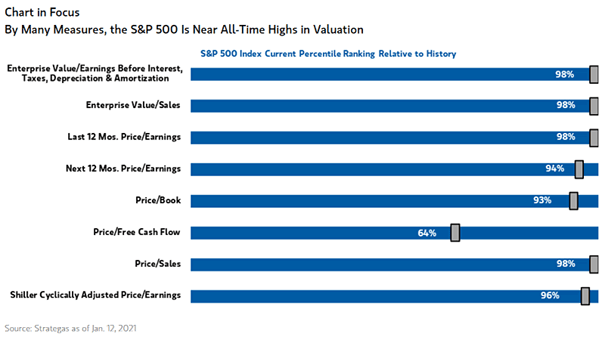
Valuation – S&P 500 Index Current Percentile Ranking Relative to History S&P 500 valuation metrics are elevated by historical standards. Image: Morgan Stanley Wealth Management
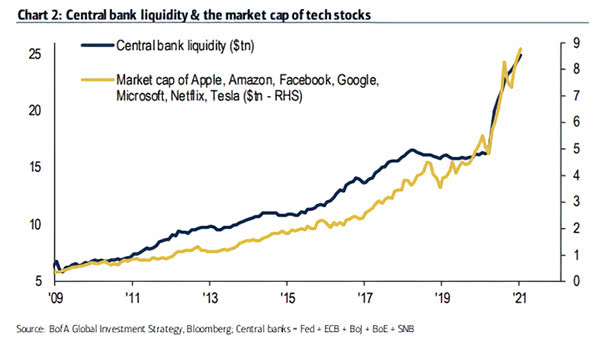
Central Bank Liquidity and the Market Capitalization of Tech Stocks Central bank liquidity tends to push tech stocks higher. Image: BofA Global Investment Strategy
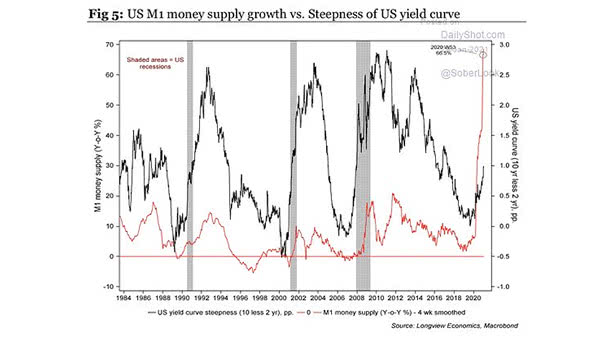
U.S. M1 Money Supply Growth vs. Steepness of U.S. Yield Curve The U.S. yield curve is expected to steepen as M1 money supply growth goes to the moon. Image: Longview Economics
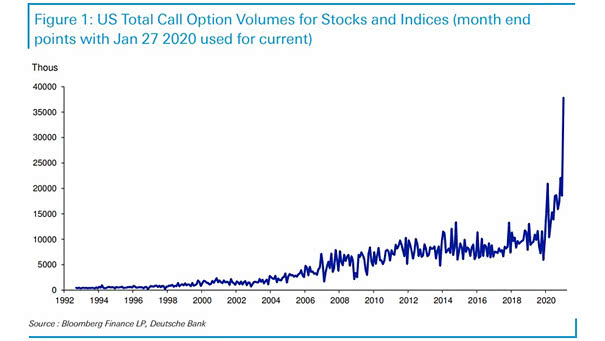
U.S. Total Call Option Volumes for Stocks and Indices U.S. total call option volume for stocks and indices is continuing to soar. Will this end well? Image: Deutsche Bank
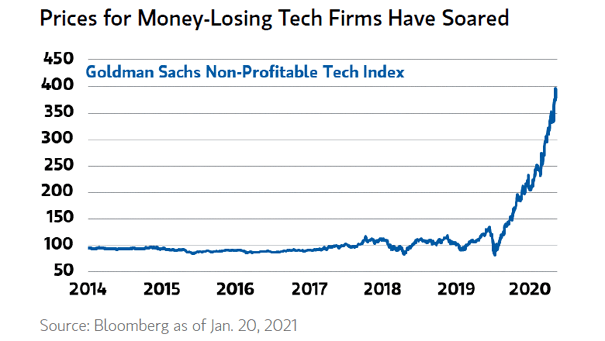
Non-Profitable U.S. Tech Companies The stock prices of non-profitable U.S. tech companies are at record highs. Should investors be worried? Image: Morgan Stanley Wealth Management
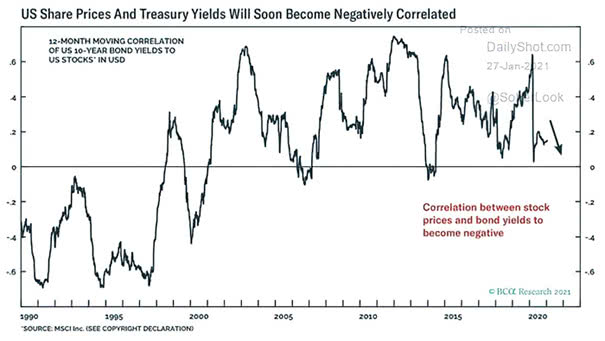
12-Month Moving Correlation of U.S. 10-Year Bond Yields to U.S. Stocks in USD The correlation between U.S. stocks and bond yields should soon become negative. Image: BCA Research
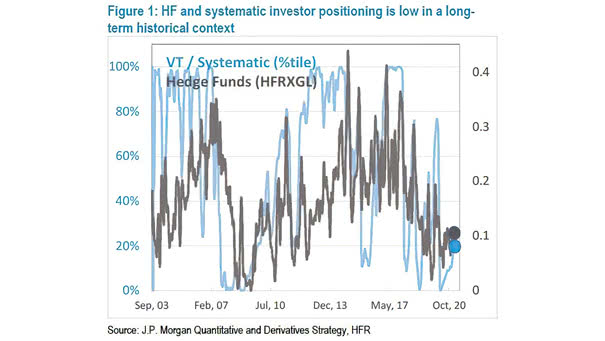
Hedge Funds and Systematic Investor Positioning Hedge funds and systematic investor positioning is low in a long-term historical context. Is any market pullback a buying opportunity? Image: J.P. Morgan Quantitative and Deratives Strategy
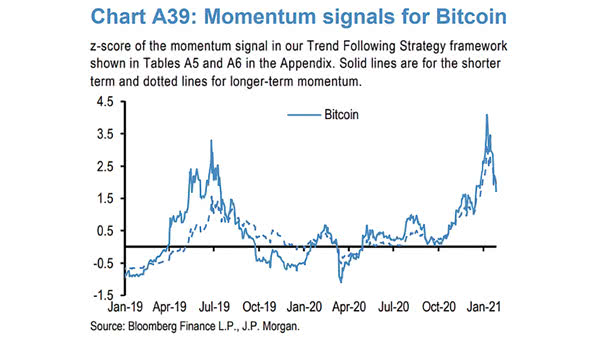
Momentum Signals for Bitcoin Is the Bitcoin fever starting to break? Image: J.P. Morgan