U.S. Equities, Margin Debt and Composite Valuation Index
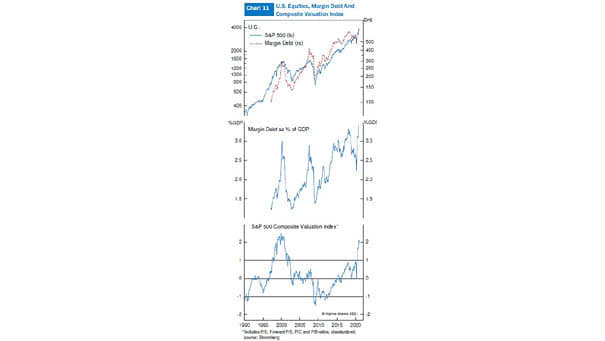
U.S. Equities, Margin Debt and Composite Valuation Index Margin debt has reached an all-time high. Does market euphoria suggest a correction coming? Image: Alpine Macro
U.S. Equities, Margin Debt and Composite Valuation Index Margin debt has reached an all-time high. Does market euphoria suggest a correction coming? Image: Alpine Macro
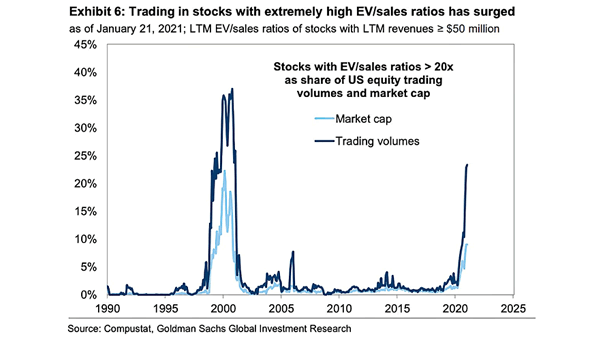
Return and Valuation – Stocks with EV/Sales Ratios Above 20x as Share of U.S. Equity Trading Volumes and Market Capitalization The median stock with an EV/sales ratio above 20x has generated a subsequent 12-month return…
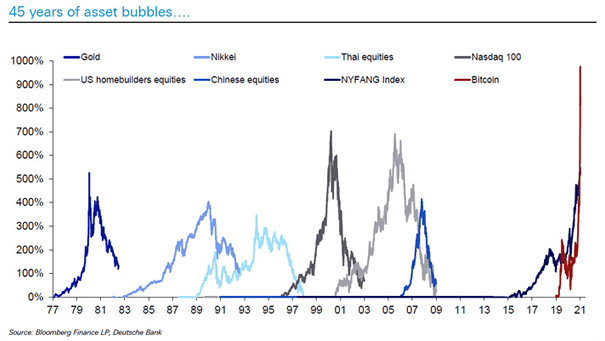
45 Years of Asset Bubbles The parabolic move of Bitcoin in a short period of time has pushed it into bubble territory. Image: Deutsche Bank
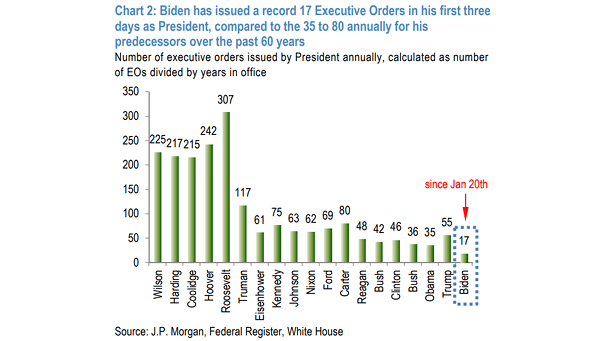
Number of Executive Orders Issued by President Annually President Biden has signed executive orders at a record pace. Image: J.P. Morgan
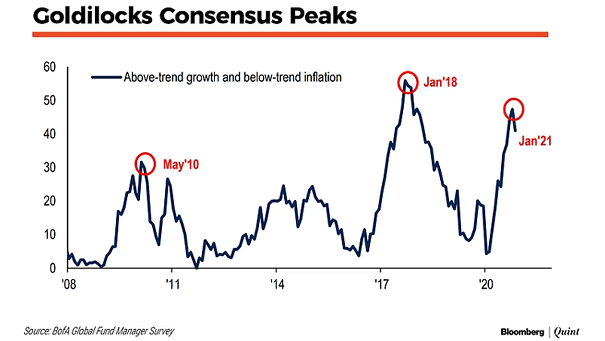
Goldilocks Consensus (Above-Trend Growth and Below-Trend Inflation) Goldilocks consensus has peaked in January, as only 41% of fund managers expect lower inflation and higher growth. Image: Bloomberg
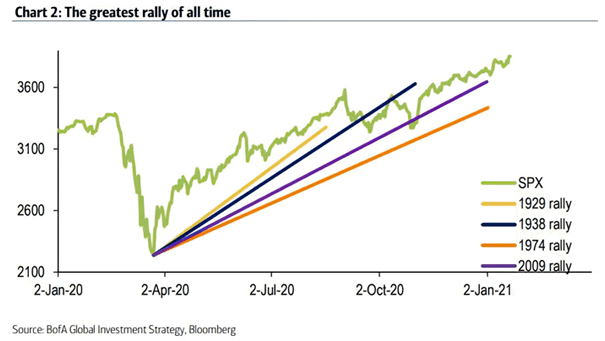
S&P 500 Rally in Comparison with Rallies in 1929, 1938, 1974 and 2009 The current rally is the greatest of all time U.S. stock market rally. Image: BofA Global Investment Strategy
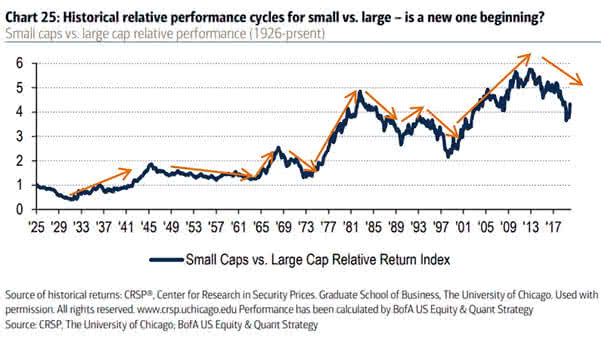
Small Caps vs. Large Cap Relative Performance Is a new small cap outperformance cycle beginning? Image: BofA US Equity & Quant Strategy
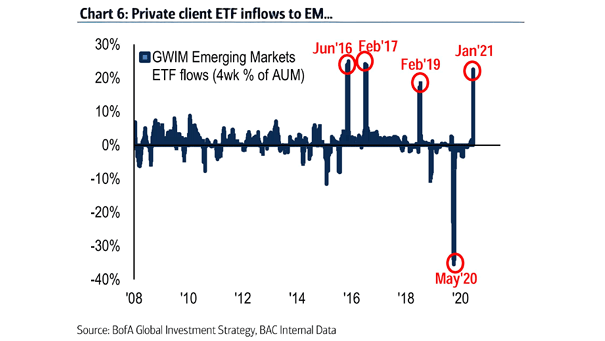
GWIM Emerging Markets ETF Flows BofA private client ETF inflows to emerging markets have accelerated sharply over the last four weeks. Image: BofA Global Investment Strategy
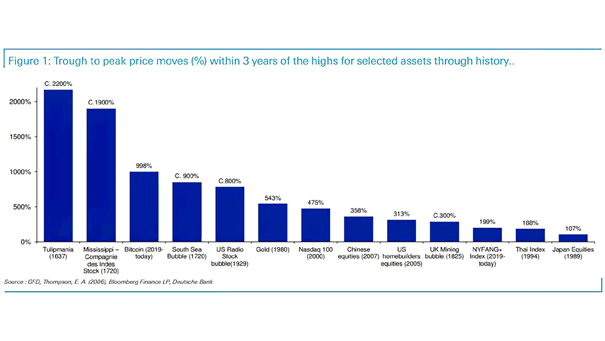
Bubbles and Bitcoin – Trough to Peak Price Moves (%) Within 3 Years of the Highs for Selected Assets Through History Bitcoin is around half of the tulip bubble in 1637. Image: Deutsche Bank Click…
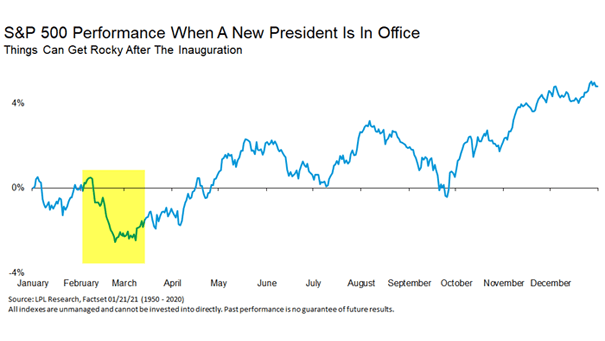
S&P 500 Performance When a New President is in Office After the presidential inauguration in the U.S., market weakness is expected in February. Image: LPL Research
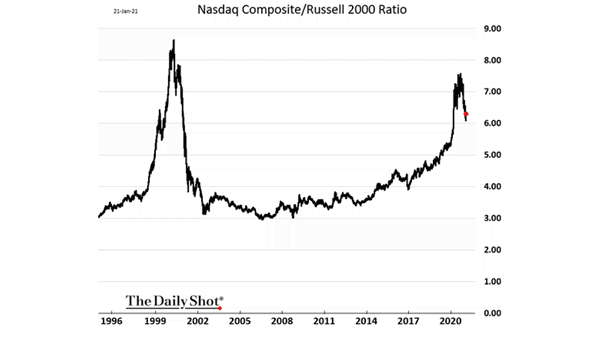
Nasdaq Composite/Russell 2000 Ratio Should investors expect the start of a long reversal? Image: The Daily Shot